Articles
Expert-led insights on AI agent observability
All articles
18 articles
The best LLM observability tools, compared on sampling, retention and price
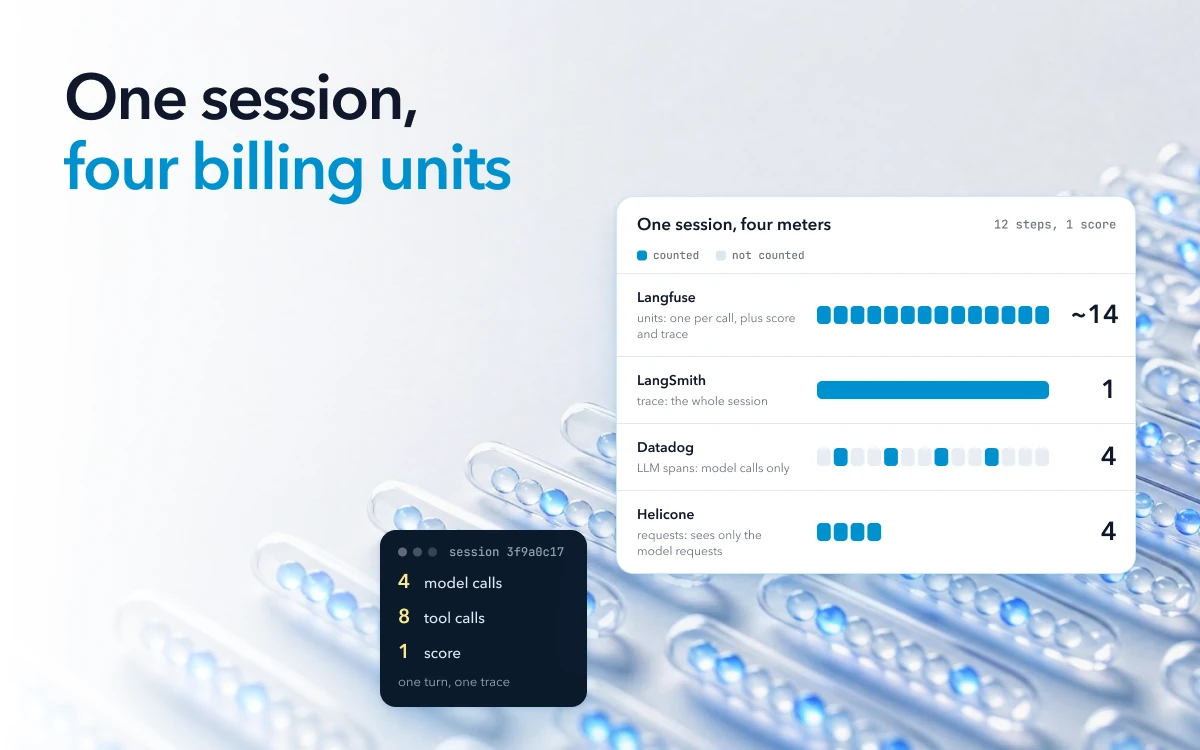
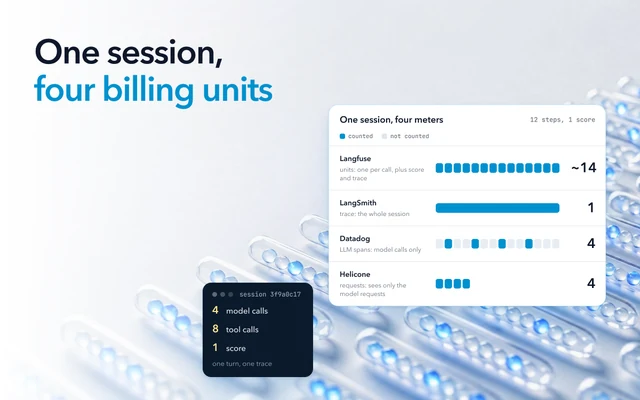
Langfuse, LangSmith, Arize Phoenix, Helicone, Datadog and Oodle each bill on a different unit. Compare what keeping every agent session costs.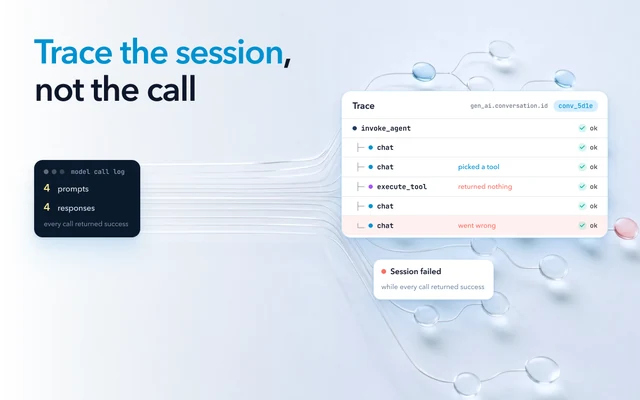
What should AI agent observability cover beyond logging each LLM call?
Agent observability covers the whole session. Each turn is a trace, the turns share one ID, and the trace follows each tool call into your services.
LangSmith vs Langfuse once your agents reach production volume
LangSmith suits LangChain teams that want one managed vendor. Langfuse suits mixed-framework teams that self-host. See how each bill grows with volume.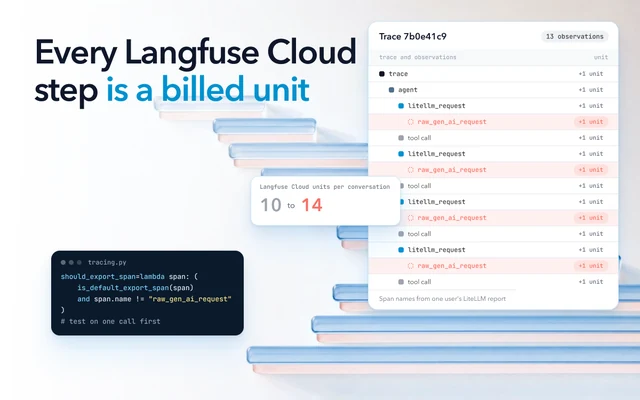
How does Langfuse pricing change as your trace volume grows?
Langfuse Cloud charges a plan fee plus usage. Every trace, observation and score is a unit, and each extra 100,000 units costs $8, falling in bands to $6.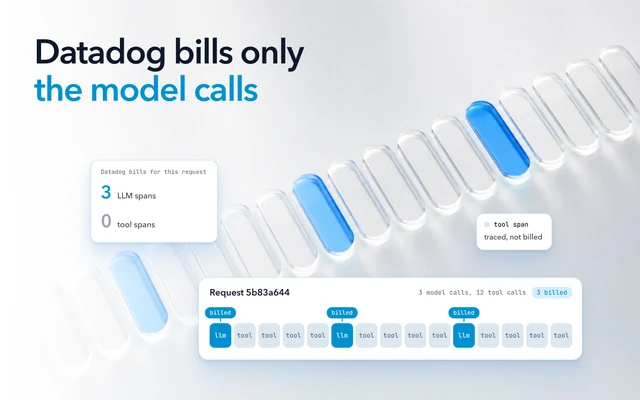
A review of Datadog LLM Observability pricing and retention for AI agents
Datadog Agent Observability, formerly LLM Observability, fits teams already on Datadog APM. It bills only model calls and keeps traces 15 days by default.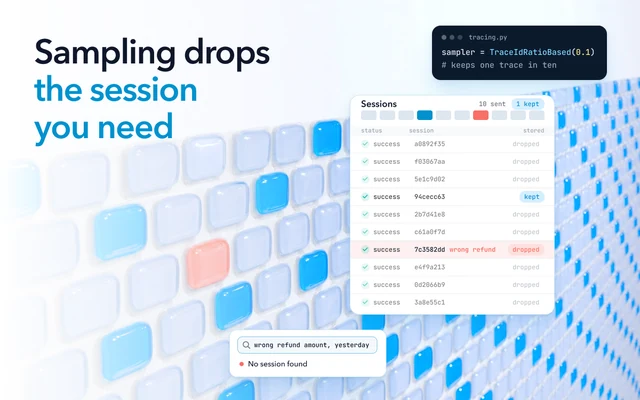
Why LLM trace sampling misses failed agent sessions
Sampled LLM traces miss failed agent sessions because many failures, such as a wrong answer, report success at every step and are dropped at random.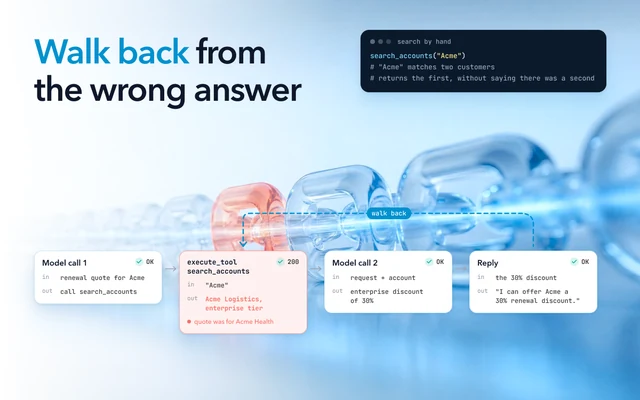
Agent debugging: finding the step that broke in a multi-step session
To find the step that broke in a multi-step agent, walk back from the wrong answer to the first step whose output was wrong although its inputs were right.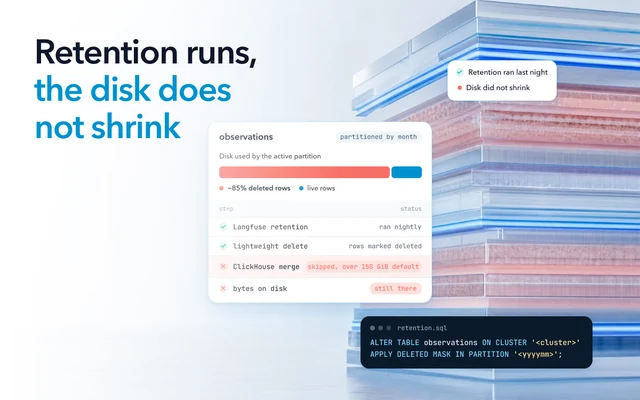
Where does self-hosted Langfuse tracing fall short at large scale?
Past a certain volume, self-hosted Langfuse is limited by ClickHouse, which it deploys as a single shard by default, so it scales only vertically.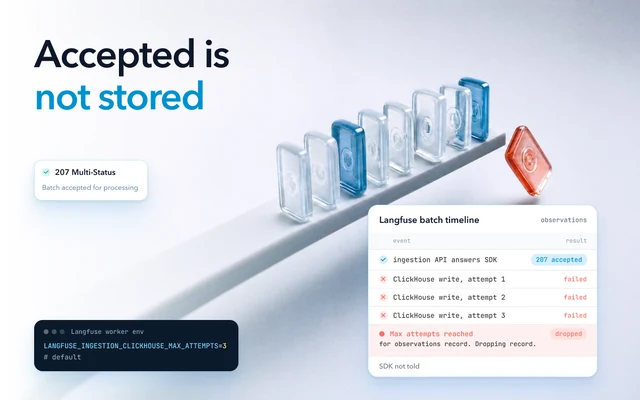
Why self-hosted Langfuse traces go missing after ingestion succeeds
In Langfuse, Phoenix and Tempo, a success response can mean a batch was only accepted for processing. A database write that fails later can drop the trace.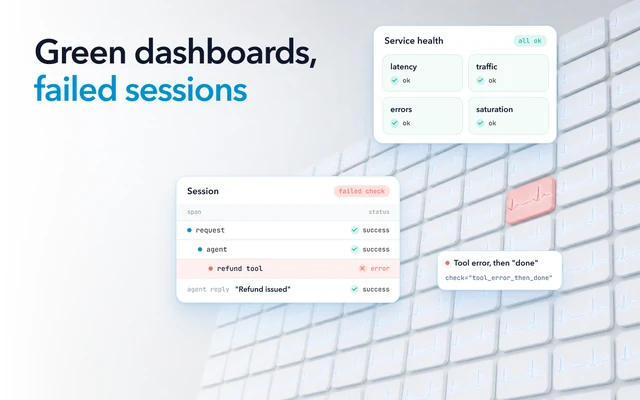
AI agent monitoring for silent failures: loops and stalled conversations
To monitor AI agents in production, define what a failed session looks like, check every session against it and alert on each agent's failure rate.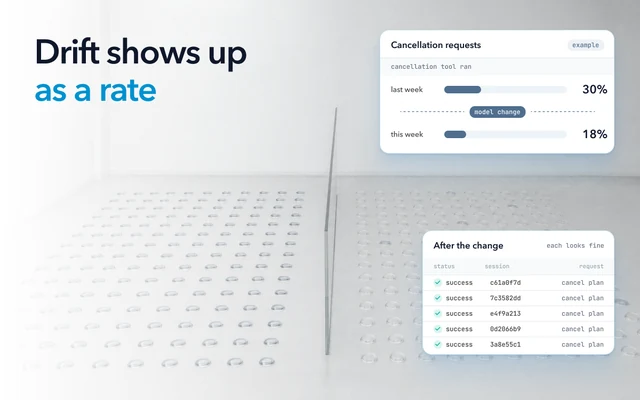
How to catch the LLM drift your evals miss after a model or prompt change
Evals test only cases written before a model or prompt change. Compare production sessions of the same kind from before and after to catch LLM drift.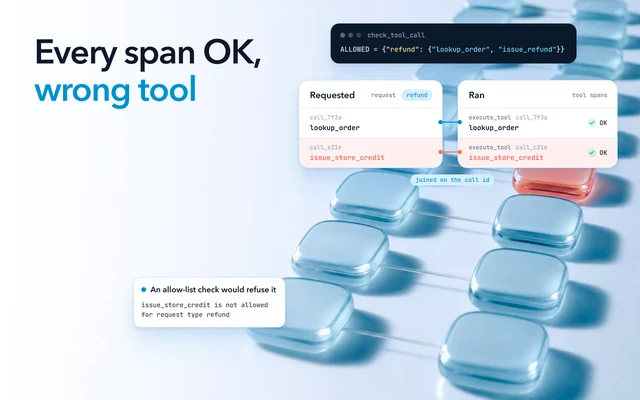
How do I catch agent tool calling errors when every span shows OK?
A wrong agent tool call returns success, and a skipped one returns nothing. Record every tool call and check it against what the request needed.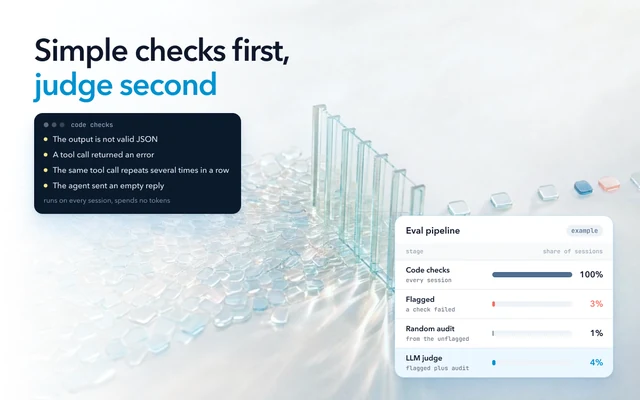
Cutting the cost of LLM-as-a-judge evals by running simple checks first
Cut LLM-as-a-judge cost by judging fewer sessions. Run code checks on every session, and send the judge only what they flag plus a small random audit.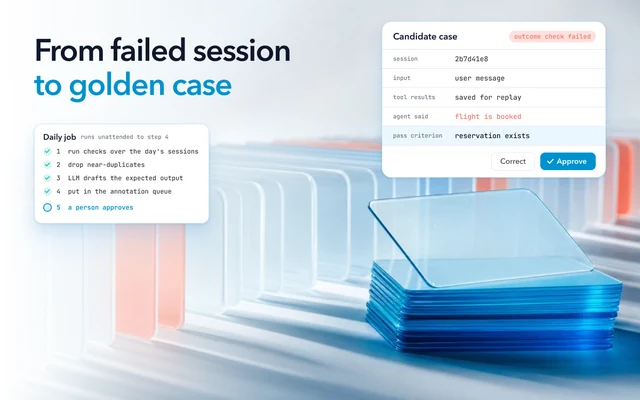
Building a golden dataset for agent evals from the production sessions you already trace
Build a golden dataset for agent evals from your production sessions. Most of the work can run on a schedule, and a person approves each expected output.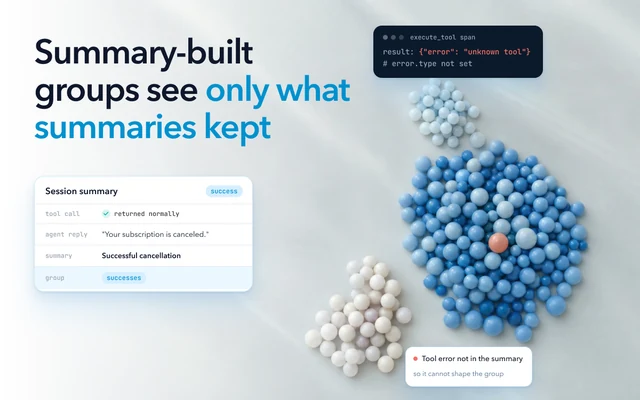
LLM error analysis at scale: clustering AI agent failures by cause
Most tools that cluster AI agent failures have a model read each session, so at volume they cap the sample, advise one, or read only sessions you pick.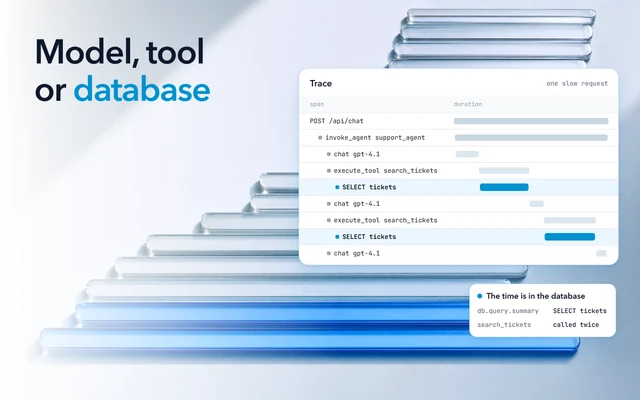
AI agent latency: one trace shows whether the model, a tool or the database is slow
To find AI agent latency, put one slow request on one trace, with a span for every model call, tool call and database query, and read its timings.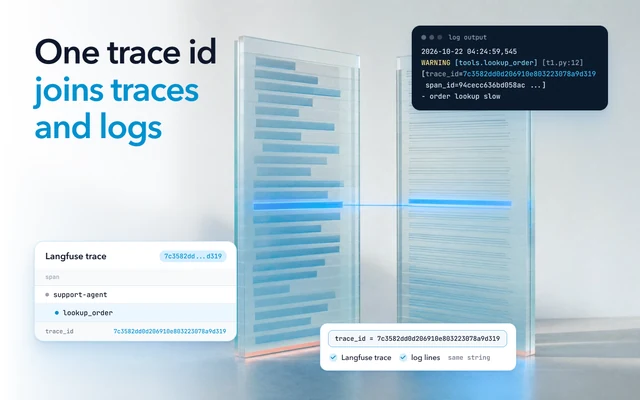
Matching LLM traces to your logs takes one shared OpenTelemetry trace id
A separate LLM tracing tool and your logs share no id by default. Give every hop the same OpenTelemetry trace id, and one id finds traces and log lines.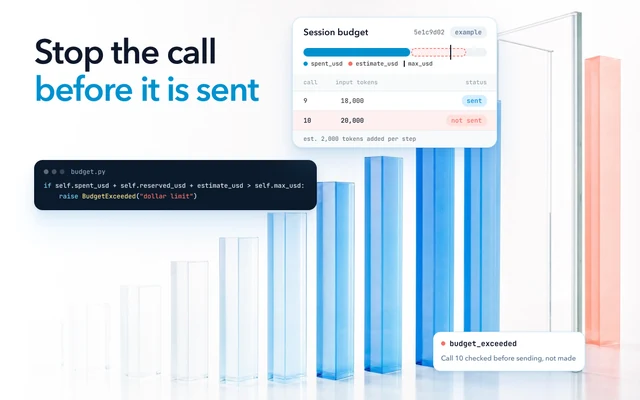
LLM cost monitoring for agents: catch a runaway session before it runs up the bill
Check a per-session budget in your own code before every model and tool call. Spend alerts, provider limits and traces report LLM cost after it is spent.