What is LLM observability, and what is agent observability?
LLM observability watches model calls one at a time, and agent observability watches each session as a whole. For each call, LLM observability keeps the prompt, the response, the tokens, the latency, any error, and often a score for the quality of the answer. That is enough for an application that calls a model once and returns the result.
An agent is different, because the model decides what happens next. An OpenTelemetry blog post describes agents as systems "where LLMs dynamically direct their own processes and tool usage". So the thing worth watching is the session. A model call can look fine on its own while the agent around it chose the wrong tool, repeated a step, or never finished the task.
The two names overlap, and vendors are moving between them. Datadog's product that was called LLM Observability is now named Agent Observability on its own pages. Here, LLM observability means watching each call, and agent observability means watching each session, which includes its calls.
What different tools call the same thing
The core terms are session, trace and span, and tools use them for different things, so two teams comparing tools can talk past each other. The neutral reference is OpenTelemetry, whose semantic conventions for generative AI define model spans and agent spans separately. Those conventions are still in development as of October 2026, so attribute names can change. This article uses each term below in one meaning only.
| Term here | What it means | OpenTelemetry semantic conventions | Langfuse | LangSmith | OpenAI Agents SDK |
|---|---|---|---|---|---|
| Session | Everything an agent does for one conversation or task, start to finish. Each turn is a trace, and the turns share one ID | A conversation, carried as gen_ai.conversation.id |
Session | Thread | Traces that share a group ID |
| Trace | One request through your system: the API request, the agent, its model and tool calls, and the services they touch | "The path of a request through your application" | Trace | Trace | Trace, one per agent run |
| Span | One unit of work inside a trace: a model call, a tool call, a database query or an agent invocation | Span, with the operations chat, execute_tool and invoke_agent named in the standard |
Observation | Run | Span |
Two words cause most of the confusion. "Run" means one step in LangSmith, where a run is the same as a span. In OpenAI's Agents SDK, an agent run means the whole execution, and it produces one trace. So this article avoids "run" altogether.
"Session" is confusing too. OpenTelemetry's core conventions use session.id for
a user's session in a browser or mobile app. An
agent's session is carried as the generative AI conversation ID instead.
Agent observability is also not agent-driven debugging, in which an AI agent does the debugging of your own systems.
Follow the whole session, turn by turn
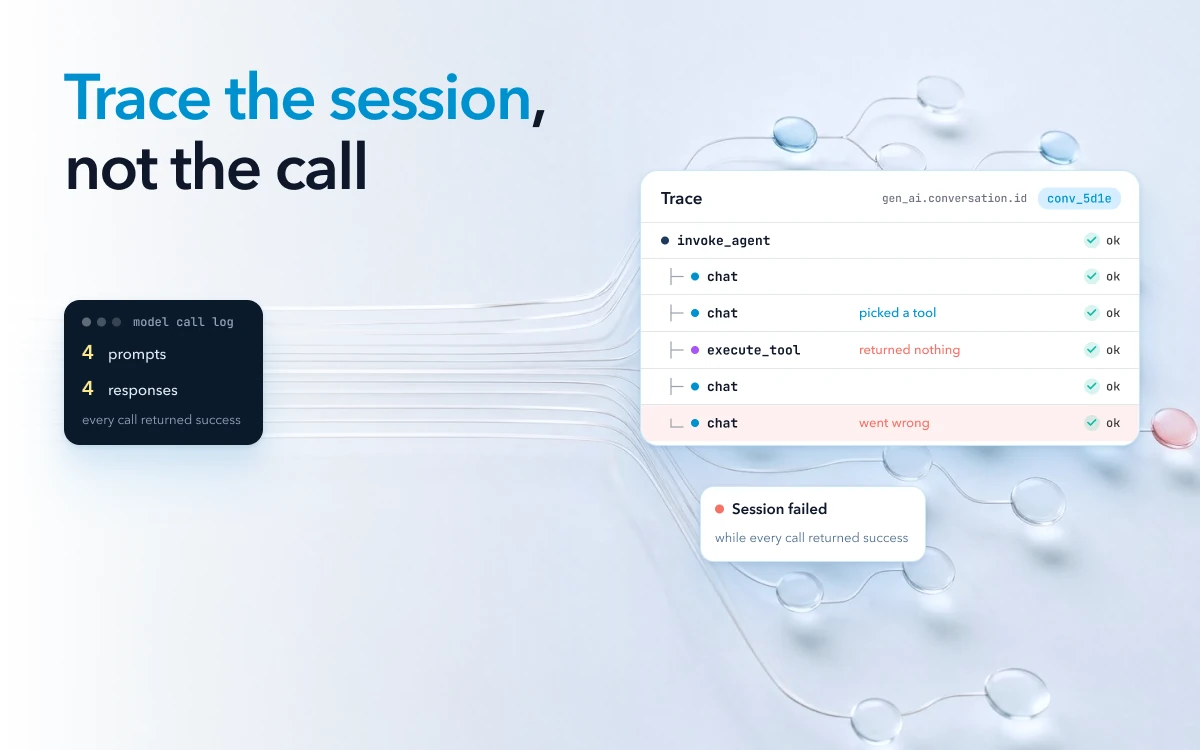
Beyond logging each call, every model call and tool call in a turn belongs in that turn's trace, under the agent that made it, in the order it happened.
In OpenTelemetry's conventions, an agent invocation is
its own span, invoke_agent,
and the model calls (chat) and tool calls (execute_tool) are
spans beneath it.
A log line per model call has none of that shape. It shows four prompts and four responses. It does not show that the
second response picked a tool, the tool returned nothing, and the fourth call went wrong because of it.
Each turn is a trace, and the turns are linked by gen_ai.conversation.id, the standard's ID for
"a conversation (session, thread)".
Set that ID from the first turn. Without it, a complaint about the fifth message in a chat cannot be traced back to
what the agent did in the second.
Capture every tool call, including the ones your own code runs
Wrap each tool your own code runs in a span of its own, because those tool calls are the steps a trace most often misses. Instrumentation for a model client library sees each request to the model. A tool the agent chose is often a function in your own code, which that library never sees.
OpenTelemetry notes that tools "are often executed directly by application code", and developers are encouraged to "manually instrument any tool calls that automatic instrumentations do not cover".
Name each tool's span for the tool, and mark the span as an error when the tool fails. The tool's arguments and result are worth having too, because a wrong argument often explains an empty result. The standard makes both opt-in attributes that may hold sensitive data, so sending them is your decision.
Follow the trace past the agent into your services and database
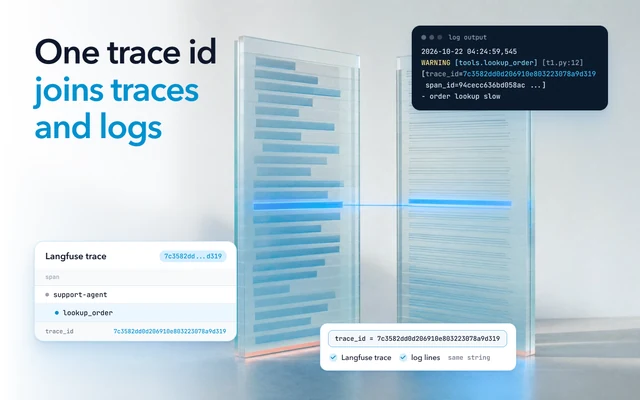
A tool call that reaches another service, such as an internal API that queries a database, joins the agent's trace only if the trace context travels with it. When one service calls another, OpenTelemetry has the caller pass a trace ID and a span ID, and the receiving service makes its span a child in the same trace. The default propagator sends them in the W3C Trace Context headers.
Instrumentation libraries usually do this for HTTP calls. A queue or custom transport that does not carry the context, or a service with no instrumentation, breaks the chain, and the trace stops at the agent.
When the context does travel, a slow or wrong answer can be followed to its cause in one view. The model call, the tool call, the API request it made and the database query under that request are all in the same trace. When it does not, the agent's trace says the tool took eight seconds, and someone has to find the matching request in another system by its timestamp.
Add up the cost of each session
The cost of a session is every model call in it, plus any paid tools it called. OpenTelemetry's spans carry the input and output tokens the provider reported for each call, and the standard has no cost attribute. So the price comes from your observability backend or from your own price table for each model.
Add the cost up per session, and per task the agent finished. A session that loops can cost several times a normal session of the same agent and still fail. Per-call logs do not give that total unless they carry the session ID and are added up by session.
The standard also defines metrics that count
model calls and tool calls per agent invocation,
such as gen_ai.invoke_agent.tool_calls. That count is the plainest early sign of a loop. An agent that usually makes
three tool calls and suddenly makes thirty is stuck, and the count shows it before anyone opens a trace.
Catch the failures that return success
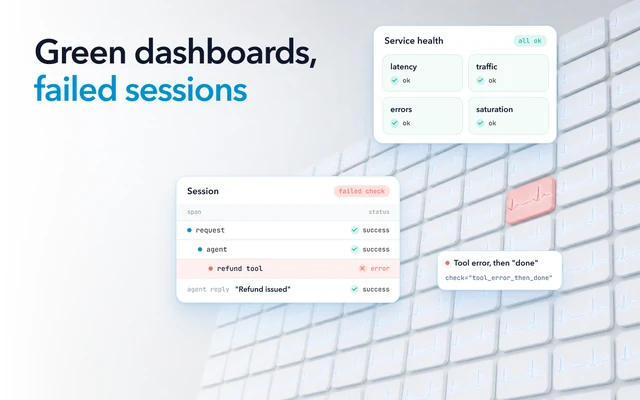
Check every session for failures that return success. The agent calls the wrong tool, repeats a step, stalls without answering, or gives a confident wrong answer, and nothing raises an error. Agents also fail the way other software does, with timeouts, crashes and rate limits, but those show up as errors. In one report on LangGraph's GitHub, a model picked a similarly named tool over the right one, and the call went through with valid arguments. "The model then reports that result to the user without any indication it noticed anything wrong." An alert on the error rate sees none of these.
So agent observability adds checks that read every session, not only its status codes. Simple checks, such as counting repeated tool calls, catch failures like these without an LLM judge. They flag the same tool called many times in a row, a tool call that failed, a token count far above normal, and a conversation that ends with no answer. A wrong answer usually needs a model to judge it, or a check against your own data, such as comparing a refund to your refund policy.
These checks work only on sessions you kept. Teams sample to control cost, and a head sampler that keeps one trace in ten decides when the trace starts, before anyone knows how the session will end. So the session a customer complains about is missing nine times out of ten, or only partly there when it has several turns.
Turn what you find into evals
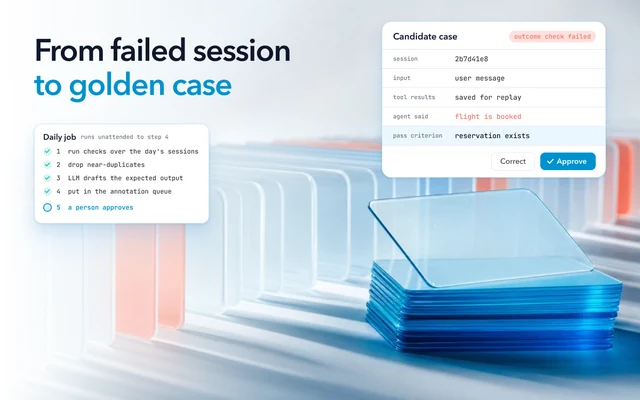
A failure found in production should become a test that the next version of the agent has to pass. For agents, an OpenTelemetry blog post says telemetry is "also used as a feedback loop", as the input to evaluation tools.
In practice, a session your checks flagged becomes a case in a dataset. The case holds the input, what the agent did and what it should have done. Before each release, an offline eval scores the agent against that dataset.
In production, online monitoring is a separate job: it runs checks on new sessions as they arrive.
Keep each eval result next to what it judged. The standard defines a
gen_ai.evaluation.result event
attached to the span being evaluated, so a score sits in the same trace as the call it scored. When a score falls,
you can go from it to the sessions behind it.
Tag versions, and decide which prompts and responses to keep
Tag the model, prompt, agent and tool versions on every trace, and decide what you keep, what you redact and who can read it before you turn capture on.
Each model span carries the name of the model that was requested. Add your prompt version, the agent's version and each tool's version as attributes on the agent span of each trace in the session. When answers get worse after a release, you can compare sessions from before and after it and find the change that did it.
Prompts and responses are where most debugging happens, and they are also where user data ends up. OpenTelemetry's instrumentation does not capture them by default, because they are "considered sensitive and are often large in size".
For production, the standard recommends keeping that content in separate storage with its own access controls, with a reference on the span.
How to check your setup against AI agent observability best practices
Take one session that went wrong last week, and try to answer these questions from your telemetry alone.
- Can you find the session at all, or was it dropped by a sampler?
- Can you open every turn of the conversation through one ID?
- Is every tool call in the trace, including tools your own code runs, with the arguments your data policy lets you keep?
- Does the trace continue into the API requests and database queries the tools made?
- What did the whole session cost, and how many model and tool calls did it make?
- Would any check have flagged it, given that no call returned an error?
- Is it now a case in an eval dataset that the next release has to pass?
Most "no" answers are instrumentation work, and that work carries over to whichever tool you choose.
Where Oodle fits
Oodle is observability built for AI agents. Some of those questions also depend on the tool: what it costs to keep every session, and whether its trace runs past the agent.
Traces go straight to object storage in Oodle's own columnar format, and queries run on serverless compute that spins up per query and shuts down after. So every session is kept in full, for your retention period (30 days on Pro, longer for an added fee).
Agent traces are kept with the logs, metrics and application traces of the same request. As long as each service passes trace context on, that single trace runs from the API request through the agent and its tools to the database.
Every session is analyzed at scale using statistics, ML classifiers and a small model for sentiment. Oodle's agent then checks each issue it finds against the evidence and removes the noise. Oodle finds tool failures, loops, outages and stalled conversations out of the box. Signals tag each session as it arrives, and insights run once a day, as a short list each morning of what to fix, with the traces behind each finding.
Setup is OpenTelemetry pointed at Oodle, so the instrumentation above carries over unchanged. You can open agent traces on the playground without signing up, or read how agent observability works in Oodle.