How Langfuse pricing counts billable units
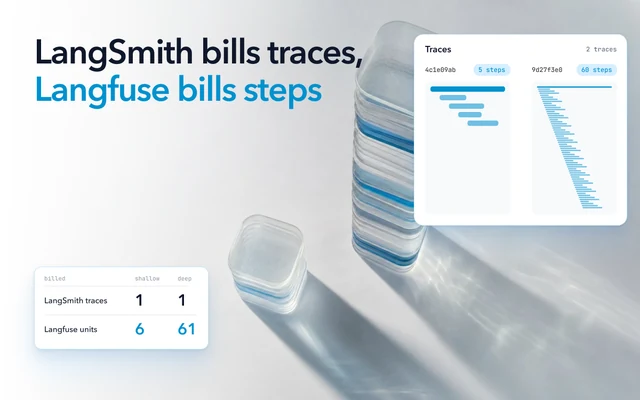
A unit is a trace, an observation or a score. An observation is one step inside a trace, such as a span, a model call (which Langfuse calls a generation) or an event. A score is an evaluation result or a piece of feedback attached to a trace.
Langfuse adds the three together for each billing period. Its docs put it as "Units = Count of Traces + Count of Observations + Count of Scores". That count includes what Langfuse creates for you. Scores and observations made by Langfuse's own features, such as LLM-as-a-Judge evaluations, annotation queues and experiments, are billed like the ones your application sends.
Observations make up most of the count. In Langfuse's own example month, 20,070 traces carried 119,500 observations and 561 scores, for 140,131 units. That is about six observations for every trace, and 85% of the units. So for an agent, the bill follows how many steps each request takes, more than how many requests there are.
You can count your own units in the Langfuse Usage Management dashboard. In your project, open Dashboards, then Langfuse Usage Management, and set the range to the last 30 days. Add the trace, observation and score counts together. Then divide the observations by the traces, which tells you how many steps an average trace records.
Langfuse Cloud pricing in 2026: plans and volume rates
Langfuse Cloud has four plans. These are the fees and allowances on Langfuse's pricing page as of October 2026.
| Plan | Monthly fee | Units included each month | Data access |
|---|---|---|---|
| Hobby | Free | 50,000 | 30 days |
| Core | $29 | 100,000 | 90 days |
| Pro | $199 | 100,000 | 3 years |
| Enterprise | $2,499 | 100,000 (custom volume pricing with a yearly commitment) | 3 years |
A Teams add-on for Pro costs $300 a month, and Enterprise includes it. The Hobby plan allows two users, and the paid plans have unlimited users.
Data access is how far back you can open your traces in Langfuse. It is a viewing window, not a deletion date. Data older than the window is still kept, and you can open it again if you move to a plan with a longer window. On Core, you can debug a conversation from up to 90 days ago.
Units above the included 100,000 are priced in bands. The rates are graduated, which means each rate applies only to the units inside its band, not to all your units.
| Units in the month | Price per 100,000 units |
|---|---|
| First 100,000 | Included in Core, Pro and Enterprise |
| 100,000 to 1 million | $8 |
| 1 million to 10 million | $7 |
| 10 million to 50 million | $6.50 |
| Above 50 million | $6 |
What Langfuse Cloud costs in a month at agent volume
A support agent that handles 50,000 conversations a day uses 15 million units a month, a usage charge of $1,027, or $1,056 on Core with the plan fee. Say each conversation is one trace with four model calls, four tool calls and one span for the agent itself. That is nine observations and one trace, or 10 units a conversation. Over 30 days, that is 1.5 million traces and 15 million units.
The first 100,000 units are included. The next 900,000 cost $72 at $8, the next 9 million cost $630 at $7, and the last 5 million cost $325 at $6.50. On Core, the month comes to $1,056 with the plan fee.
The rate falls as you grow, but by a quarter at most, from $8 to $6. Units grow with every step your agent takes, so the steps matter more than the rate.
Now change the agent. Each row below keeps the 50,000 conversations a day and changes one thing.
| The same agent, when... | Units a month | Usage charge |
|---|---|---|
| it runs as described (10 units a conversation) | 15 million | $1,027 |
| a new version makes two more tool calls (12 units) | 18 million | $1,222 |
| an integration adds an extra observation to every model call (14 units) | 21 million | $1,417 |
| you keep 10% of conversations (10 units each) | 1.5 million | $107 |
Two more tool calls add a fifth to the units and about a fifth to the bill. An evaluator that scores every conversation adds one more unit to each trace as well.
Why one extra observation per LLM call can add 40% or more to your units
To stop it, find the layer or integration that creates the extra observation, then stop it there or drop the observation before it is sent. Every observation is a unit, so an integration that records a second observation for each model call adds one unit per call, whether or not the second observation tells you anything.
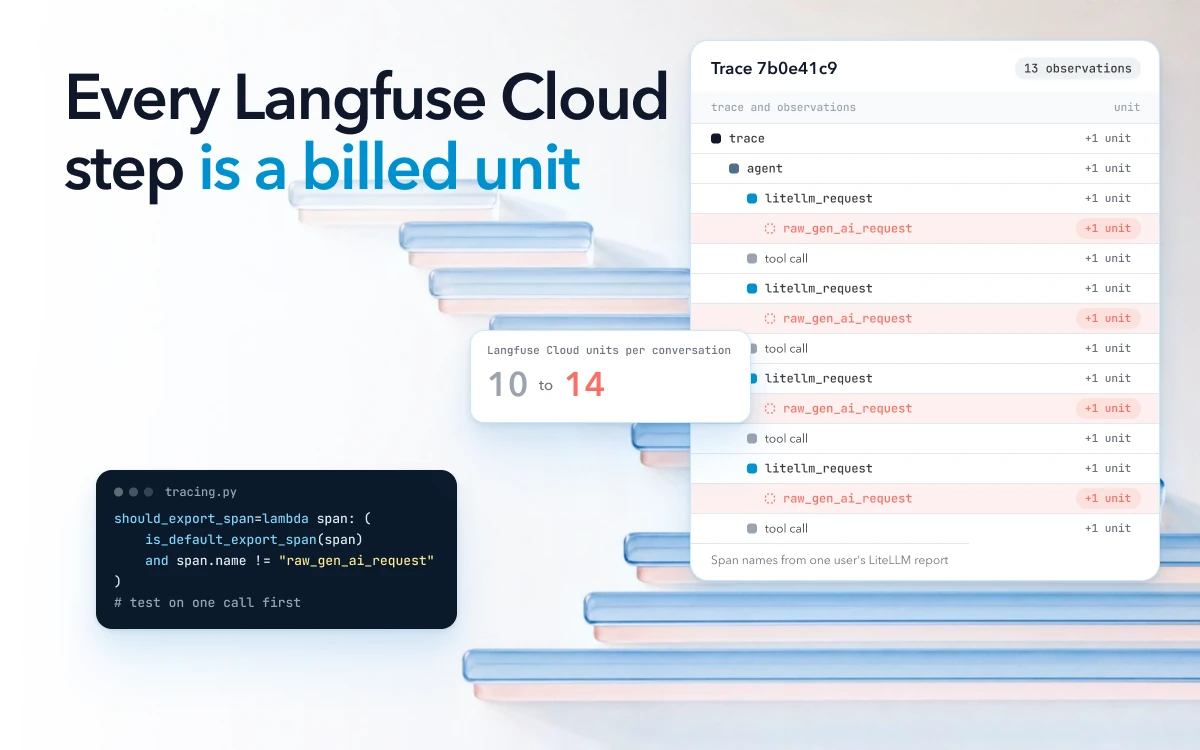
One user moving to Langfuse's v3 SDK reported this in November 2025. LiteLLM, the open-source LLM proxy, added an observation called raw_gen_ai_request under each litellm_request observation. The user wrote that "it doubles the observation usage for each LLM call, which hurts when you have a high volume of calls." The same user later found that "this is caused by litellm's OTEL implementation", asked LiteLLM for a way to turn the span off, and posted a workaround that patches LiteLLM so it never creates the span:
import litellm
litellm.integrations.opentelemetry.OpenTelemetry._maybe_log_raw_request = (
    lambda self, *args, **kwargs: None
)
The request was closed as not planned in April 2026. As of October 2026, Langfuse has not confirmed a fix in the thread.
For an application that is mostly model calls, an extra observation per call comes close to doubling the units. For the support agent above, which also makes tool calls, it takes the month from 15 million units to 21 million, 40% more, and the usage charge from $1,027 to $1,417, 38% more.
The same arithmetic applies to anything sent twice. Where a tool bills by data ingested, anything your code sends twice is counted twice. That includes Oodle, which bills by the gigabyte ingested, so a span your code sends twice costs twice on Oodle too.
Check whether you are tracing the same call twice
A common cause of an extra observation is two layers recording the same call. An automatic integration, such as a framework callback or a wrapped model client, records the call. Then a decorator or a manual span in your own code records it again. A proxy that logs to the same Langfuse project as your application does the same. Choose one layer to record each model call, and remove the other.
A parent span with one generation inside it is normal, and not a duplicate. The parent is the step in your agent, and the generation is the model call it made.
To find the source, open the trace for one ordinary request and count its observations. Langfuse shows which library created each observation under metadata.scope.name. That name is the OpenTelemetry instrumentation scope, the name a library gives the spans it creates. Two observations for one call from two different scopes means two layers are recording it. Two from the same scope, as in the LiteLLM report, comes from that one integration.
Drop the observations you do not need before they are sent
Langfuse's SDKs decide which OpenTelemetry spans to send as observations with an export filter. By default, as of October 2026, they send spans created by the Langfuse SDK, spans with the generative AI attributes (gen_ai.*) from OpenTelemetry's semantic conventions, and spans from a list of known LLM libraries. That list includes LiteLLM, so the default filter keeps LiteLLM's spans.
You can pass your own filter: should_export_span in Python, or shouldExportSpan in JavaScript. Passing one replaces the default. To keep the default and drop more, Langfuse's docs combine your rule with is_default_export_span. Applied to the span name in the LiteLLM report, that pattern looks like this in Python.
from langfuse import Langfuse
from langfuse.span_filter import is_default_export_span

langfuse = Langfuse(
    should_export_span=lambda span: (
        is_default_export_span(span)
        and span.name != "raw_gen_ai_request"  # the extra span named in the report
    )
)
Langfuse documents the filter, but its examples block whole instrumentation scopes, not single span names. As of October 2026, neither the docs nor the GitHub thread confirm that a filter like this drops raw_gen_ai_request and nothing else. Blocking the whole litellm scope would not help, because it would also drop litellm_request, which is the observation you want.
Test the filter on one call before you rely on it. Turn on debug logging with LANGFUSE_DEBUG="True", which logs the spans the filter drops. Then check the trace in Langfuse: litellm_request should still be there, and raw_gen_ai_request should be gone. Langfuse also warns that dropping a span that has children leaves those children orphaned in the trace view, so look for that too.
What self-hosting Langfuse costs instead
Self-hosted Langfuse is free under the MIT license, with no usage bill and no limit on units. Instead, you pay for and run what it runs on.
A self-hosted deployment has two application containers and four storage components:
- Langfuse Web, which serves the UI and the APIs
- Langfuse Worker, which processes incoming events in the background
- Postgres, the main database for transactional data
- ClickHouse, which holds traces, observations and scores
- Redis or Valkey, for queues and caching
- S3 or another object store, where every incoming event is written first
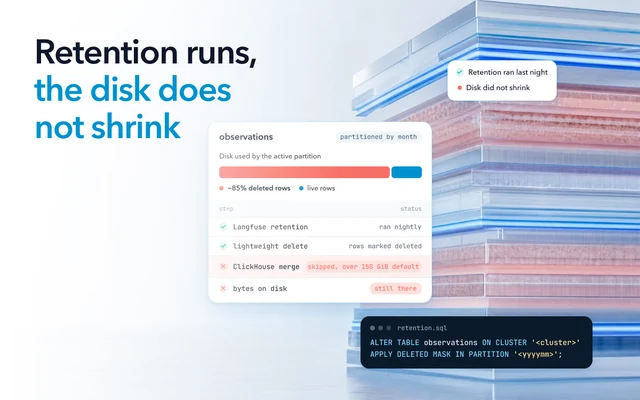
Langfuse's Docker Compose setup runs on a single VM without high availability, scaling or backups. For production, Langfuse's docs list Kubernetes with Helm or a cloud provider. Automatic data retention policies need the Enterprise edition, which is paid.
So self-hosting swaps the per-unit bill for a cloud bill and the time to run six components. Volume still costs you, because every observation is still processed by the worker and held in ClickHouse.
Why teams on Langfuse sample as volume grows
Every trace you keep is billed for all its units, so sampling cuts the units you are billed for by the share of traces it drops, and Langfuse names it as one of two ways to cut costs. In the words of its cost FAQ, you can cut costs "by sampling fewer traces or logging only essential data". The second is the observation filtering above.
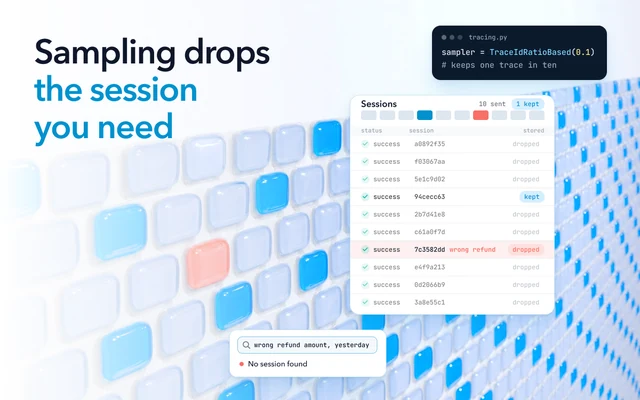
In Langfuse, sampling happens in the SDK, before anything is sent. In Python you set LANGFUSE_SAMPLE_RATE to a value between 0 and 1. Left at its default of 1, it keeps every trace. A trace that is not kept sends none of its observations or scores, so none of it is billed. At 10%, the support agent's 15 million units become 1.5 million, and the usage charge falls from $1,027 to $107.
Teams do this at volume. One user asking Langfuse for per-pipeline rates described pipelines that are "used very often (few million samples / day), so we need a sampling there", while wanting everything kept for pipelines with under 100 calls a day. Self-hosting does not remove the reason to sample either. A user running Langfuse on their own servers wrote that "I have a high volume of traffic on production, therefore, I implemented a 7-day data retention period (along with a sampling rate)."
But sampling has a cost, and Langfuse states it too. Its cost FAQ says "Keeping all traces is often valuable for LLM application development." It also says sampling by error level "isn't feasible since you only know if a trace is interesting after completion". With random sampling, your chance of still having any one trace is the same as your sample rate. At 10%, the conversation a customer complains about is missing nine times out of ten.
Langfuse's own conclusion is that "if your application operates at significant scale, sampling can be a reasonable cost-cutting strategy." Before you set a rate, decide which traffic you debug one conversation at a time. Keep all of that, and sample the high-volume pipelines you only watch for trends.
How Oodle keeps every session at this volume
On Langfuse Cloud, each step an agent takes is another unit, so keeping every step of every trace means paying for every unit. Oodle writes traces to object storage and runs each query on serverless compute, which starts when the query arrives and stops when it is done. Oodle keeps every session for your retention period (30 days on Pro, longer for an added fee).
Oodle bills agent traces by the gigabyte ingested, not by the step. Oodle has simple, ingest-based pricing, starting at $1 per GB, and is cost efficient. There are no seat or query fees.
Billing by the gigabyte counts bytes, not steps, so large spans cost more, for example in an agent that puts long documents into every prompt. Check the size of your own traces.
At this pricing, sampling stays your choice. Fello, a real estate technology company, runs 6 million agent traces a day on Oodle, with none of them sampled. Oodle runs as a hosted service, so there is no infrastructure for you to run. Bring your own cloud (BYOC) and bring your own bucket (BYOB) are Enterprise options, for agent observability as well as logs, metrics and traces. If you use the Langfuse SDK, only the endpoint changes.