Why the dashboards stay green when an agent fails
Service monitoring tells you whether each call succeeded and how long it took, and an agent can fail with every call succeeding. Most dashboards and alerts are built from what Google's SRE book calls the four golden signals: latency, traffic, errors and saturation. None of the four says whether the agent did the task.
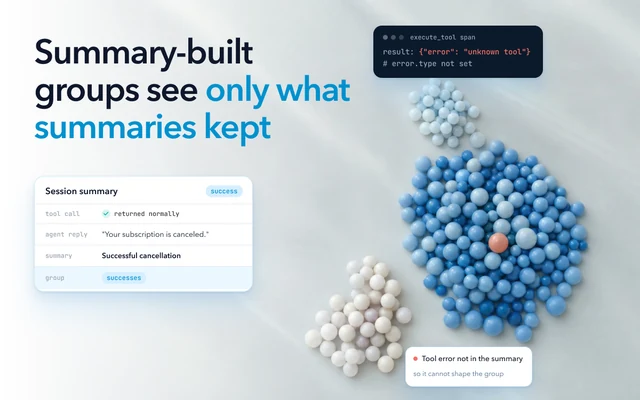
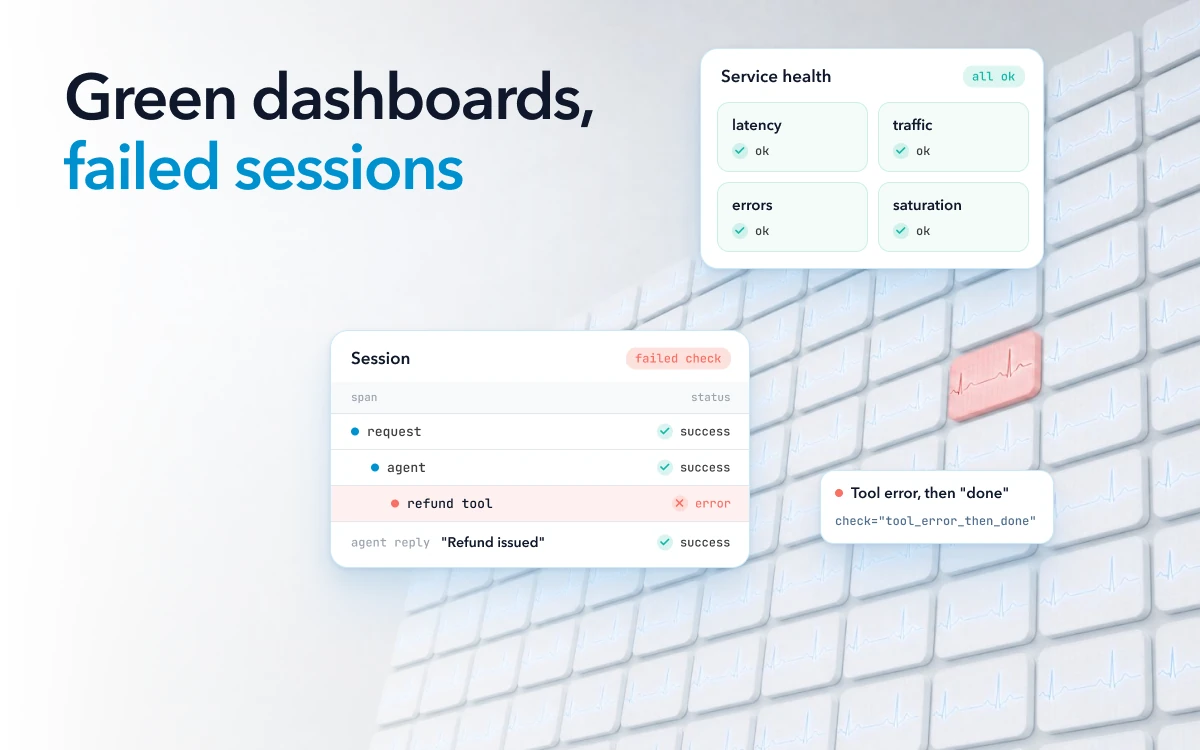
Tracing the agent does not change that on its own. Under OpenTelemetry's conventions, a span's status must be left unset when the operation ends without an error. An error that was retried or handled should not be recorded on the span of the operation that handled it, and the GenAI conventions for model and tool calls follow the same rules. So when a tool returns an error and the agent carries on and tells the user the job is done, the tool span may show the error, but the agent and request spans can read as a success.
Many AI agent failure modes need no error at all. A study of multi-agent systems that annotated more than 1,600 traces found 14 failure modes, among them repeating steps, not knowing when to stop, ending a task early and skipping verification. On LangChain's forum, a user described a deep agent that stopped after reading its files, left its own to-do list unfinished and raised no error. A failure like that is found by whoever reads the result, and that is often the customer.
Agents also fail the way other software does, with timeouts, crashes and rate limits, and those do show up as errors. So the error alerts stay. They are necessary, but on their own they miss loops, stuck conversations and tool errors the agent ignored.
Write down your AI agent's failure modes as session checks
A failed session is one where the outcome the agent reported is not real, or the trace shows a pattern failed sessions leave behind. No error marks it, so you define it yourself, for each agent. A session is one conversation or task an agent handles from start to finish, and each check reads one session and answers yes or no.
Outcome checks compare what the agent said it did with what happened. Anthropic's guide to offline agent evals uses a booking agent that says "Your flight has been booked", where the real test is whether the reservation exists in the database. The same idea applies in production. For a support agent, that means reading the billing system after the agent says a refund was issued, or the ticketing system after it says a ticket was filed. For a task that changes something, the agent's own "done" is never the result.
Trace checks read the trace itself. Most need no model. Spotting a restated request may need a text match. Each one looks for a pattern that failed sessions leave behind.
| Check | What it looks for in the session |
|---|---|
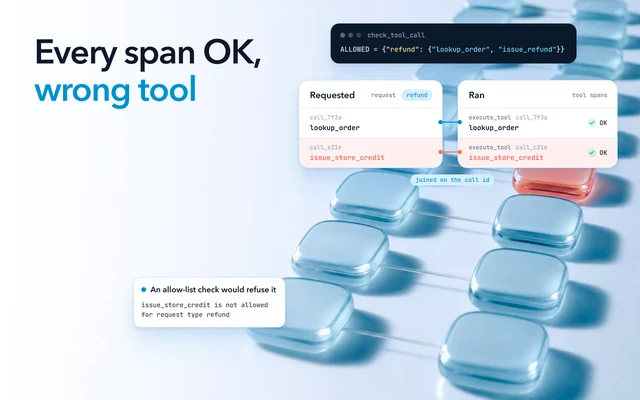
| Tool error, then "done" | A tool call returned an error, or an error message as its result, and the agent's next reply reports success |
| Repeated call | The same tool with the same arguments, several times in a short stretch |
| New arguments, same result | The same tool again and again, with arguments that change and a result that does not |
| Two tools in turn | One tool, then another, then the first again, with nothing new coming back |
| User asks again | The user restates the same request in a later turn |
| User stops replying | The conversation goes quiet before the task is done |
| No end state | The session ends without a final answer, or without the end state the task needed |
| Dependency down | A rate limit, a timeout or a 503 from a service the agent called |
Count the last row apart from the others. A session that failed because a dependency was down is an outage, and it belongs on the alerts of whoever owns that dependency, not in the agent's failure rate.
Some failures pass every check in the table, such as a confident answer that is wrong. Those need a judge model or a person. Run the judge on the sessions the cheaper checks flag, plus a small sample of the rest, and the bill for judging stays small.
Loops and stuck sessions a step counter misses
A step counter stops a long loop, but it cannot see a short loop or a conversation that gets stuck across turns, so loops need checks of their own. One engineer on LangChain's forum wrote that teams mostly rely on step counters or "do not repeat yourself" prompts to keep agents out of tool-calling loops. The counters in the common frameworks work like this, as of October 2026.
| Framework | Setting | Default | At the limit |
|---|---|---|---|
| OpenAI Agents SDK | max_turns |
10 model calls (openai-agents 0.24.0) | Raises MaxTurnsExceeded |
| LangGraph | recursion_limit |
10,007 steps (langgraph 1.2.16) | Raises GRAPH_RECURSION_LIMIT, which the docs say is "often due to an infinite loop" |
| CrewAI | max_iter |
20 iterations | The agent must provide its best answer |
Each of these counts steps inside one run. That catches a loop long enough to reach the limit, and in the OpenAI SDK and LangGraph it ends that loop with an error by default, so the loop is not silent. LangGraph's default of 10,007 steps, though, lets a loop run a very long time before it stops. In CrewAI it ends in an answer that can look like any other. Counting steps misses a short loop, a conversation stuck across turns and a long task that was working.
- A loop shorter than the limit. Three identical refund calls under a limit of 10 finish with no error.
- A conversation stuck across turns. Each turn is a new run with a fresh count, so a user asking for the same thing for the third time never reaches the limit.
- A long task that was working. A limit low enough to catch loops also cuts off legitimate long runs. LangGraph's docs note that complex graphs may hit the default limit naturally, and the engineer who opened the forum thread says that when a timeout fires it leaves the state half-executed.
To catch a loop inside a session, read the order of the tool calls instead of counting them. The Python check below takes one session's tool calls in order and returns the loop patterns it finds. It skips tools that repeat on purpose, because, as a reply in the same thread points out, retries, polling, and pagination can all repeat legitimately. The window of six calls and the limit of three are examples. Set both from your own sessions.
import json

REPEATS_ON_PURPOSE = {"poll_job_status", "list_page"}  # polling and pagination tools

def loop_flags(tool_calls, window=6, limit=3):
    """tool_calls: one session's tool calls in order, as (name, arguments, result)."""
    flags = set()
    recent = []
    for name, args, result in tool_calls:
        if name in REPEATS_ON_PURPOSE:
            continue
        call = (name, json.dumps(args, sort_keys=True, default=str), json.dumps(result, sort_keys=True, default=str))
        recent = (recent + [call])[-window:]
        same_tool = [c for c in recent if c[0] == name]
        if sum(1 for c in same_tool if c[1] == same_tool[-1][1]) >= limit:
            flags.add("same call repeated")
        elif len(same_tool) >= limit and len({c[2] for c in same_tool}) == 1:
            flags.add("same tool, changing arguments, same result")
        names = [c[0] for c in recent[-4:]]
        if (len(names) == 4 and names[0] == names[2] != names[1] == names[3]
                and len({c[2] for c in recent[-4:]}) <= 2):
            flags.add("two tools alternating")
    return flags
A stuck conversation needs a check across turns, because no single turn looks wrong. Put a conversation id on every
turn's spans, such as OpenTelemetry's
gen_ai.conversation.id,
so the turns can be read together. Then flag the conversation when the user restates a request, when a turn passes
with no tool call and no change to the task, or when the conversation ends without the end state the task needed.
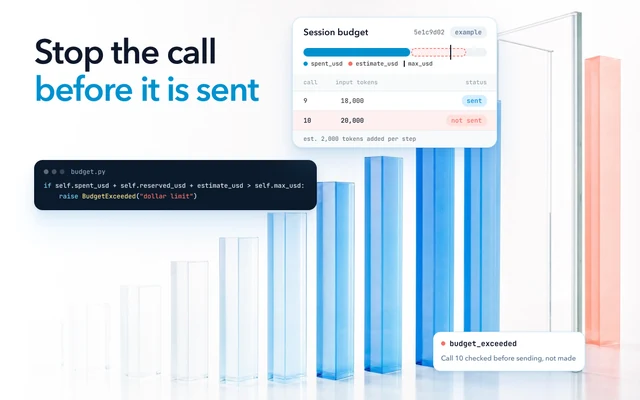
Inside the agent, the fix for a repeat loop is to tell the model what it already tried. An agent that is not shown the earlier failure has no way to recognize that the call already failed, so return the earlier failure to the model instead of running the same call again. Keep the step counter too, set well above your longest normal session, as a backstop on cost.
What AI agent monitoring should track beyond uptime and latency
Turn each check into a rate, and watch the rates for each agent next to the error, latency and uptime numbers you already have.
| Measure | What it tells you |
|---|---|
| Share of sessions that failed any check | The headline number for each agent |
| Verified task success | Sessions whose end state was confirmed in the system that holds it, not in the agent's reply |
| Tool errors, including the ones the agent ignored | Counted from each tool's result, since the span status misses the handled ones |
| Loop rate and stuck rate | Sessions flagged by the loop and cross-turn checks |
| Users asking again, and users who stop replying | The user's side of a stuck conversation |
| Steps per session | A jump after a release is worth reading a few sessions for |
| Sessions hit by an outage | Kept on their own line, so a dependency's bad hour does not count against the agent |
Split every rate by agent version as well as by agent. A prompt or model change that makes things worse then shows as a step in one line instead of a small rise in the total.
Alert on the share of sessions that fail, per agent
Alert when the share of an agent's sessions that fail a check is high over both a long and a short window, and only once enough sessions have run for the share to mean something.
Start by giving every session one result when it ends: ok, failed or outage. Sessions that end in an exception count too, so
set the result from the code that started the agent, in a finally block, and not only at the agent's last step. Then
expose the results as counters.
- Count each session's result in a counter labeled by agent and result.
- Count each failed check in a second counter labeled by agent and check.
- Create each agent's counters at zero when the process starts.
Alerting on the share of failed sessions is the method Google's SRE workbook uses for service level objectives. A service level indicator, or SLI, is the ratio of good events to total events, and the workbook says error budgets and error rates apply to all SLIs, not only the ones named for errors. Here a session that passed every check is a good event.
The workbook alerts on the rate of bad events over more than one time window, with the short window 1/12 the duration of the long one. The long window shows the problem is real, and the short one shows it is still happening.
Two more settings keep a rate alert quiet when it should be. A minimum session count stops a quiet agent from paging on
one bad session out of three, since alerting
gets sensitive to small events at low traffic. And a
for clause keeps the alert pending until
the condition has held for a set time.
A rate can also hide the one failure that matters every time, such as a refund the agent reported as issued after the refund tool returned an error. Alert on any count above zero for a check like that.
As Prometheus rules, those alerts, plus two for when sessions stop arriving, look like this. The first pages when more than 5% of an agent's sessions failed a check over both the last hour and the last five minutes, once that agent has had more than 50 sessions in the hour. The 5% and the 50 are examples. Set them from your agent's normal failure rate and traffic.
groups:
  - name: agent-sessions
    rules:
      - alert: AgentSessionsFailingChecks
        expr: |
          (
              sum by (agent) (rate(agent_sessions_total{result="failed"}[1h]))
            / sum by (agent) (rate(agent_sessions_total{result!="outage"}[1h]))
            > 0.05
          )
          and
          (
              sum by (agent) (rate(agent_sessions_total{result="failed"}[5m]))
            / sum by (agent) (rate(agent_sessions_total{result!="outage"}[5m]))
            > 0.05
          )
          and
          sum by (agent) (increase(agent_sessions_total{result!="outage"}[1h])) > 50
        for: 2m
        annotations:
          summary: "{{ $labels.agent }}: more than 5% of sessions failed a check"
      - alert: AgentToolErrorReportedAsDone
        expr: sum by (agent) (increase(agent_check_failures_total{check="tool_error_then_done"}[15m])) > 0
      - alert: AgentNoSessions
        expr: sum by (agent) (increase(agent_sessions_total[1h])) == 0
      - alert: AgentSessionsMissing
        expr: absent_over_time(agent_sessions_total[15m])
        for: 5m
The last two rules catch an agent that stopped, because an agent that stopped running produces no failures to alert
on. The first fires for each agent that is still reporting but had no sessions in the last hour. The second fires when the session counter stops being reported at all, as when the process is down, and
it covers all agents together. It needs
absent_over_time, which takes a time range. The
plain absent function does not take a time range,
so absent(agent_sessions_total[15m]) is not valid PromQL.
Make the alert point at sessions. A message that says the failure rate went from 2% to 9% sends someone searching. A link to that agent's failed sessions in the last hour lets them read what went wrong.
How to know the checks and the alert work
Test them with a failure you planted before you trust them to find one you did not. In staging, make one tool return an
error the agent can ignore, run enough sessions to pass the minimum session count, and keep the failure going past
the for time (or lower both in staging). Confirm that each session is flagged, the failure rate rises and the alert
fires, and run promtool test rules on the rules before they go live.
Then look back. When you add a check, run it over last week's sessions and see whether it finds the failure a customer already reported. If it does not, fix the check. Before a new check pages anyone, read a sample of the sessions it flags and confirm they failed. A scheduled task with a known answer, run against production every hour, also tells you the agent still finishes the job end to end when real traffic is quiet.
Every one of these checks reads a session you kept. If you sample your traces to keep the bill down, the session a customer reports may not be there to check.
Finding loops and stuck conversations in every session with Oodle
Every session is kept in full, for your retention period (30 days on Pro, longer for an added fee). That is affordable because of how Oodle is built. Traces go straight to object storage in Oodle's own columnar format, and queries run on serverless compute that spins up per query and shuts down after.
Oodle identifies issues in your agents out of the box, such as tool failures, loops, outages and stalled conversations, as each session arrives. Loop and stuck checks read whole sessions, so they work best when every session is kept and read as it arrives. Every session is analyzed at scale using statistics, ML classifiers and a small model for sentiment. Oodle's agent then checks each issue it finds against the evidence and removes the noise.
Insights run once a day, as a short list each morning of what went wrong, how often and why, with the traces behind each finding attached and each finding marked real, unclear or likely noise. When you fix a failure, describe it in one sentence. Oodle drafts the check, you approve it, and Oodle checks every new session for it. Oodle alerts when the rate of a signal or insight changes for an agent. The insights page shows the kinds of failure it looks for, and you can open agent sessions in the Oodle playground without signing up.