Which LLM error analysis tools group agent failures by cause
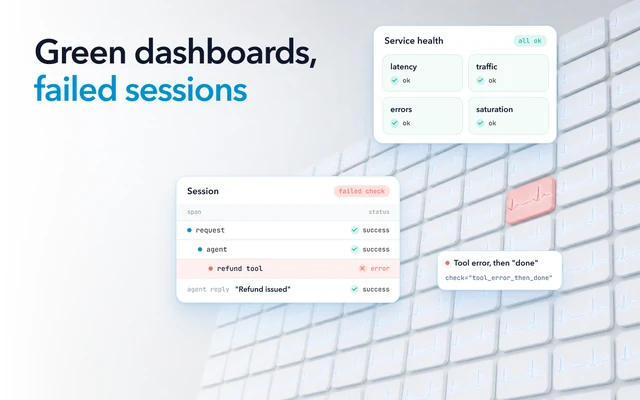
LangSmith Insights and Braintrust Topics have a model summarize sessions and cluster the summaries, LangSmith Engine uses an agent, Amazon Bedrock AgentCore runs a model-based failure analysis on the sessions you select, and a fifth kind checks every session first. They differ in how much of your traffic they read and in how they read each session, and those choices decide whether you can trust a group. As of October 2026, from each tool's own docs:
| How the tool reads your sessions | How much of your traffic it reads | What reading a session costs |
|---|---|---|
| A model writes a short summary of each trace, and a second model clusters the summaries (LangSmith Insights) | A sample of up to 1,000 traces per report | Model tokens, about $1 to $2 per 1,000 threads with OpenAI models and $3 to $4 with Anthropic models |
| A model summarizes each trace, an embedding model turns each summary into a vector, and a clustering algorithm groups them once at least 100 summaries exist. A model then names each cluster (Braintrust Topics) | 100% by default, with the vendor advising 1 to 5% on high-volume projects | Model credits on Starter and Pro plans, then on-demand token rates |
| An agent reads a share of your traces, adds the low-scoring ones, and opens issues with a diagnosis and the traces behind it, then keeps adding matching traces, reopening an issue that comes back (LangSmith Engine) | A share set by an analysis level | Usage units at $1 each, growing with the traces read and the model calls the agent makes, with a default cap of 750 a month |
| A model analyzes every span in each session, finds the cause, and groups similar failures across sessions by root cause, with a count of sessions affected (Amazon Bedrock AgentCore failure analysis). The earlier insights preview stopped taking new jobs October 16, 2026 | The sessions you select for a batch evaluation, by time range or session ID | Model tokens at batch evaluation rates. Insights free during the preview |
| Checks on every session raise issues, and Oodle's agent verifies each against the traces and groups what is left by cause | Every session | Out-of-the-box insights are included. Oodle has simple, ingest-based pricing, starting at $1 per GB, and is cost efficient |
In the first four rows a model does the reading, and the cost grows with every session read. One tool caps its sample, and another tells you to turn the rate down at volume to save credit. The sample is where the trouble with the groups starts.
Why the share of sessions a tool reads decides whether a group is true
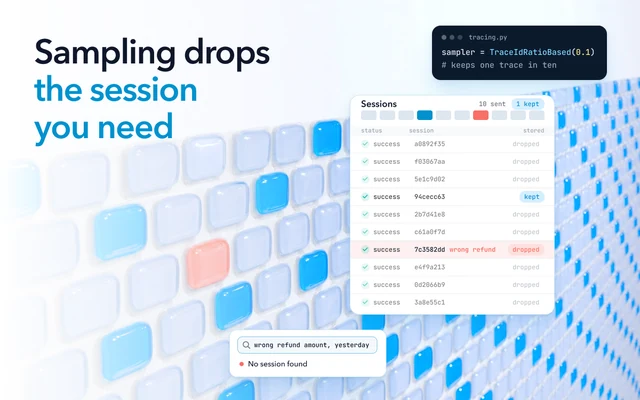
A group found in a sample shows the failures common enough to land in it, and can miss the rare ones. Take a failure that hits 1 session in 5,000, and a tool that reads a random 1,000 sessions. You would expect 0.2 of the failing sessions in the sample. The chance that even one lands there is about 18%, which is 1 minus 0.9998 to the power of 1,000. They assume a random sample and sessions that fail independently.
So about four reports in five never see that failure, and when one does, a group of one session tells you nothing about how often. At 50,000 sessions a day, the same failure still hits about 10 sessions a day.
The size of a group inside a sample is an estimate too. If 12 of 1,000 sampled sessions land in a group, the failure's real rate across all your sessions could be anywhere from about 0.7% to 2%, by a 95% confidence interval. That is enough to rank the large groups. It is not enough to tell whether a fix halved one.
A sample steered toward bad scores has a gap of its own. One tool's agent pulls the low-scoring traces for each evaluator score into its sample. That helps it find what your evaluators already score badly. A failure that no evaluator scores is left to whatever else the sample picks up.
The sampling gap matters little for a failure that hits 1% of your sessions or more, because a random sample of 1,000 will hold about ten of them. The gap is in the rare failures, and in any number you want to act on.
Why a group built from summaries sees only what the summaries kept
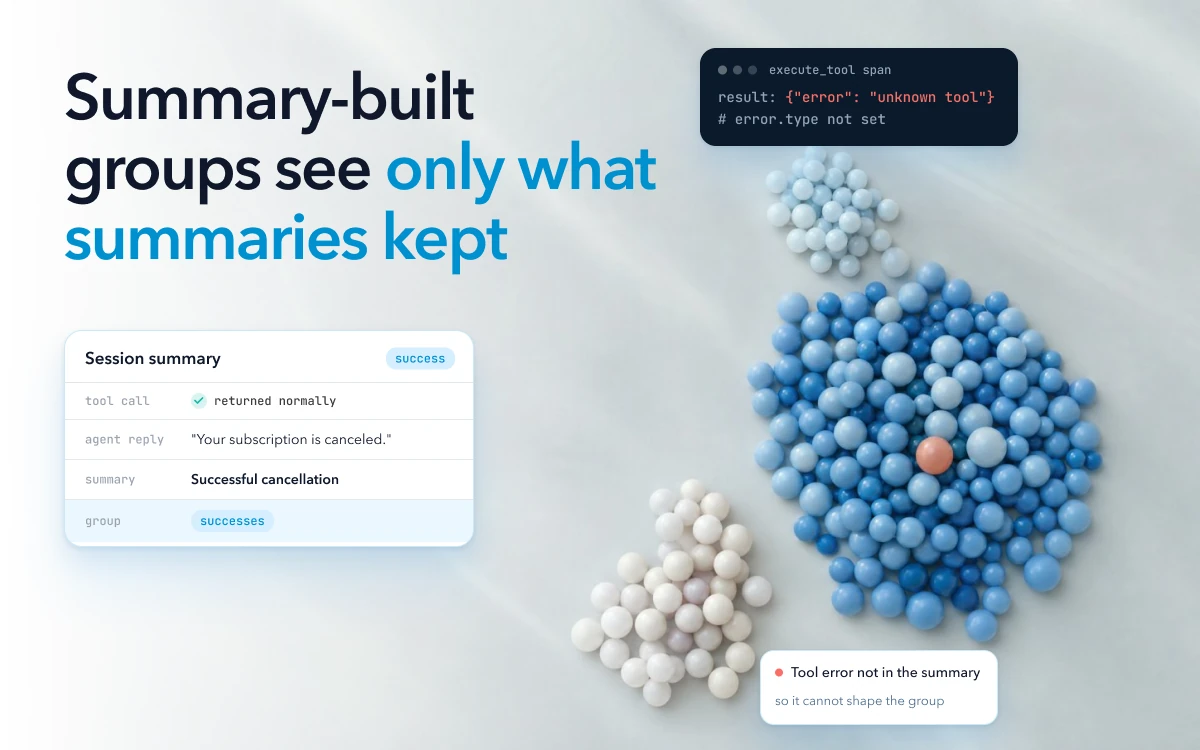
A group built from summaries cannot be shaped by anything the summary left out. Each trace the tool reads is first condensed into a short description, and the descriptions are what get grouped. One vendor's docs state the consequence: "Any information that isn't in the trace summary won't affect the categories that get generated".
That matters most for the failures agents hide. Say your agent calls a tool that returns {"error": "unknown tool"},
and the model then tells the customer their subscription is canceled. The tool returned normally, so its span
carries no error class, because OpenTelemetry's GenAI conventions call for error.type only
if the operation ended in an error.
A summary written from that conversation can read like a successful cancellation. The session then lands in a group
of successes, or in no group at all.
You can tell the summarizer to look for errors returned as results, and a better summary prompt gives better groups. But each group is still only as good as that prompt. And every summary uses model credits, which is why, at volume, one caps its sample and another advises sampling.
Count tool failures across every session without reading a trace
Count the execute_tool spans that carry error.type, per session, beside the number of sessions in the same window.
That number, the one every group should be checked against, comes from your spans and needs no model. If your agent follows
OpenTelemetry's GenAI conventions, each tool call is a span named
execute_tool {gen_ai.tool.name}.
A call that ended in an error carries
error.type,
a short error class such as timeout.
The spans of one session share
gen_ai.conversation.id
when it is set. Most of these attributes are still at
Development status,
so look at a few of your own spans first to see which ones your instrumentation sets.
The query below counts, for the last day, how many sessions hit each tool and error class, next to the number of sessions in the same window. It is written for a backend that keeps span attributes in a map, so change the table and attribute syntax to match yours.
If you do not set gen_ai.conversation.id, use your own session attribute, or the trace id where one session is one
trace.
SELECT
  attributes['gen_ai.tool.name'] AS tool,
  attributes['error.type']       AS error_class,
  count(DISTINCT attributes['gen_ai.conversation.id']) AS sessions_hit,
  (SELECT count(DISTINCT attributes['gen_ai.conversation.id'])
     FROM spans
    WHERE start_time > now() - INTERVAL 1 DAY) AS all_sessions
FROM spans
WHERE attributes['gen_ai.operation.name'] = 'execute_tool'
  AND attributes['error.type'] <> ''
  AND start_time > now() - INTERVAL 1 DAY
GROUP BY tool, error_class
ORDER BY sessions_hit DESC;
Then add the failures that raise no error.
- An error returned as the tool's result. In the code that calls your tools, check each result for an error
payload. When you find one, treat it as a failed call and set
error.typeon the span. The query above then counts it. - The same tool called again and again. Count
execute_toolspans per session and tool name, and flag the sessions far above what a normal session does. - A user asking the same thing again, or going quiet. This one needs the conversation text, which OpenTelemetry instrumentation does not capture by default.
These counts add to the failures the query finds, and all_sessions is the denominator. When a tool reports a group, you can now say what share of all sessions the
failure behind it reached.
Check a group before you act on it
Compare the group's size with your count, open about two dozen of its sessions, and find the cause in the trace.
- Compare sizes over the same window. Count the failure the group describes across every session, and set it beside the size the tool reports. A group much larger or smaller than your count came from a sample that does not match your traffic, from summaries that merged different failures or dropped this one, or from a different definition of the failure.
- Open about two dozen of the group's sessions. Count how many really share the cause. If a third of them failed for another reason, the group joined two failures, and fixing one will not empty it.
- Find the cause in the trace. The cause the tool names should show up as a span, an error or a tool result, not only in a summary. Root-cause text written by a model is a hypothesis until the trace shows it.
Counts have a limit too. They find only the failures you thought to look for, and a model's grouping is how you find the kinds you have no rule for. Keep both. Good agent failure analysis uses the model's groups to find new kinds of failure, and your counts to size them.
Confirm a fix by watching the failure's count fall in new sessions
A fix has worked when the count for that failure falls to zero in sessions that started after the change shipped. It has to stay at zero over at least as many new sessions as it used to take to see the failure. A group missing from the next sampled report proves less, because a rare failure can drop out of a sample by chance.
Once a failure is fixed, keep its check running on every new session, so you hear the day it comes back.
Before the next change to the prompt, the model or the tool ships, a few of its sessions also make good test cases.
What product and support people need to see when the agent fails a customer
Product and support people need the grouped list in plain words, single sessions told as conversations, and a decision on what conversation text they may see. They hear the complaints and are often not the people who read traces. A feature request on one agent tracing tool says so: the people fielding feedback "are not the engineers who built it". The questions that request lists are "Is the agent working for most users right now?" and "Which user sessions are failing and why?". An engineer on another tool was building a simpler view of eval results for non-technical colleagues, because the tool's own screen is "information overload for those folks".
Give them views built on the same sessions your engineers use.
- The grouped list in plain words: what went wrong, how many sessions and users it hit, and since when.
- One session told as a conversation: what the user asked, what the agent said, and each tool call as a readable step, such as looking up order 4471 and finding nothing, with a link to the full trace for an engineer.
- A decision on what conversation text they may see. OpenTelemetry's GenAI conventions treat prompts and model outputs as sensitive, and instrumentation leaves them out by default, so a view built on spans may have no conversation to show until you choose what to capture and who can read it.
A support lead needs to know how many users were affected. That number needs every session, with a user id on each one. A sample gives an estimate, and a customer who asks whether others were hit wants a count.
How Oodle groups agent failures across every session
Each session the model-based tools above read costs model tokens or credits, which is why at volume they read a sample. Oodle starts from checks that read every session.
Every session is analyzed at scale using statistics, ML classifiers and a small model for sentiment. Oodle's agent then checks each issue it finds against the evidence and removes the noise.
The checks find issues such as tool failures, loops, outages and stalled conversations. Oodle's agent groups what is left by cause, ranked by how many customers it affected.
Signals tag each session as it arrives. Insights run once a day, as a short list each morning of what went wrong, how often and why. Insight reports are for product and support people as well as engineers. Each finding is marked real, unclear or likely noise, with the traces behind it attached, so you can see whether the cause is in the trace before you act. A finding opens Claude Code or Cursor with the failing traces in the prompt. After the fix, the rule keeps checking every new session.
Traces go straight to object storage in Oodle's own columnar format, and queries run on serverless compute that spins up per query and shuts down after. So every agent trace is kept for your retention period (30 days on Pro, longer for an added fee), and the sessions behind a finding are there to open. The checks read every session, so each failure they find is counted across all your sessions.