Why teams use LLM trace sampling
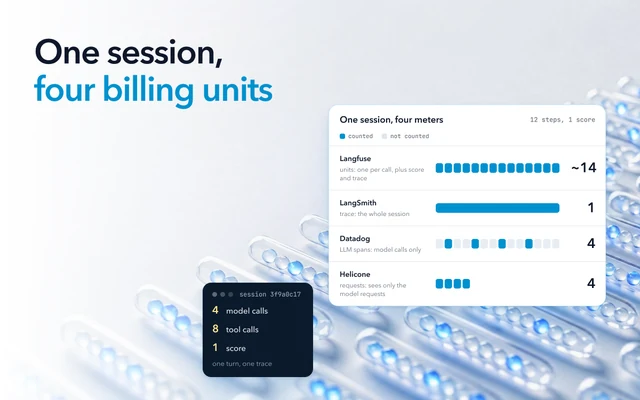
Teams sample because of the bill. Many LLM tracing tools charge by how much you send them, and agents send a lot, because every model call and tool call becomes a span. Tracing tools sell their sampling settings in those terms, as a way of helping you "balance observability needs with cost considerations". As traffic grows, many teams turn the rate down to keep the bill under control.
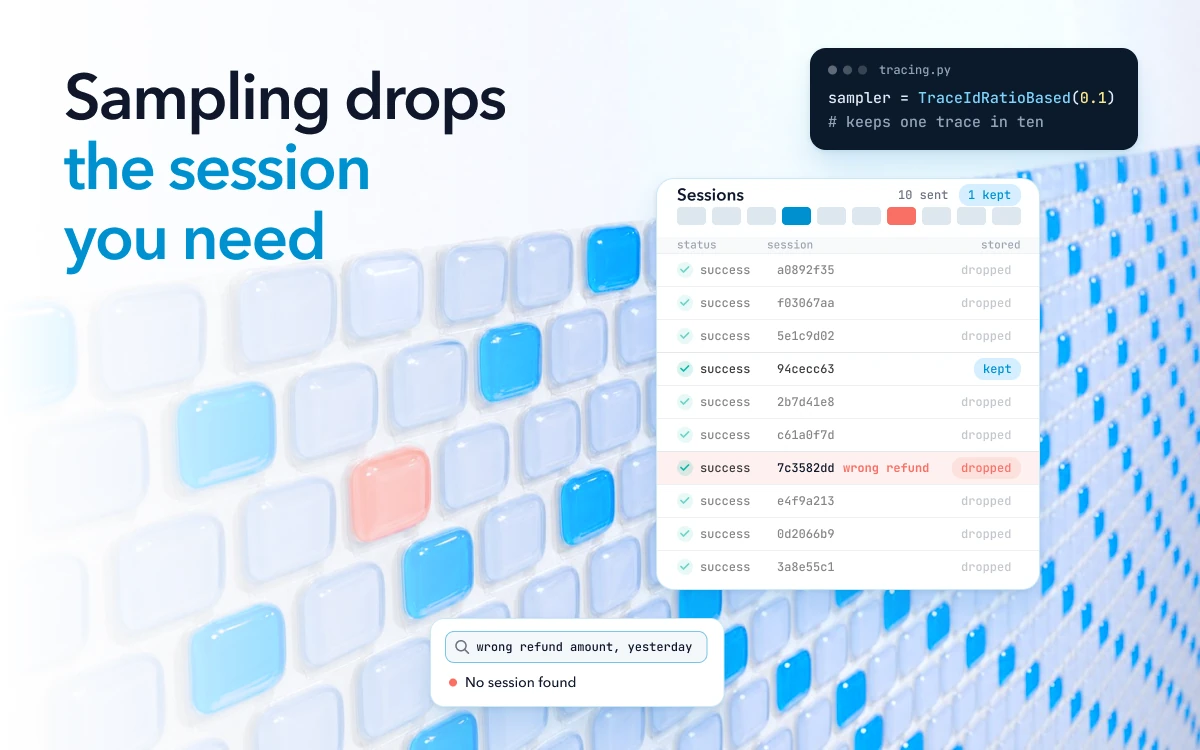
The cost of that shows up when a customer writes in to say your support agent gave them a wrong refund amount yesterday. You open your tracing tool to see what the agent did, and the session is not there, because your tool was set to keep only some of them.
A session is one conversation or task an agent handles from start to finish. Each step, such as a model call or a tool call, is a span, and the spans from one request make up a trace. A short session like this refund request is one trace. A longer session can be several. Sampling keeps a share of traces, the sample rate, and throws the rest away: a 10% rate keeps one trace in ten.
What are the odds you kept the session you need?
When you debug, you need one specific session, and the odds that you kept it equal your sample rate. That holds when every session has the same random chance of being kept and each decision is made independently. The odds on this page are for a session that is one trace, sampled on its own.
When you watch for problems, you only need some of the failures. Say 20 sessions fail in a day. At a 10% rate, the chance you kept at least one of the 20 is 88%. In general it is 1 minus (1 minus the sample rate) to the power of 20.
| Sample rate | Chance you kept a specific failed session | Chance you kept at least one of 20 failed sessions |
|---|---|---|
| 1% | 1% | 18% |
| 5% | 5% | 64% |
| 10% | 10% | 88% |
| 25% | 25% | over 99% |
The right column is good news if you want to know that failures are happening, as long as something flags the failed sessions you kept. But when a customer reports a problem and you need that exact session, the middle column is the one that applies. Even at 25%, three out of every four complaints point to a session you no longer have.
Users of the tracing tools see the same trade-off. A Langfuse user asking for a way to keep traces by outcome described it this way: "You effectively have to weigh cost of a high sampling rate against the probability of catching crucial errors."
Where does sampling happen in agent tracing tools?
In the most common agent tracing tools, and in the OpenTelemetry SDKs many of them build on, sampling happens inside the SDK, before the trace leaves your service.
- Langfuse's Python SDK reads a setting called
LANGFUSE_SAMPLE_RATE, from 0 to 1. Its JavaScript SDK takes an OpenTelemetry sampler instead (as of October 2026). Either way, the sampling docs say the decision is made in your code, per trace, and a trace it drops never sends any of its spans. - LangSmith reads a setting called
LANGSMITH_TRACING_SAMPLING_RATE, also from 0 to 1, as of October 2026. Setting it to 0.75 keeps 75% of traces. - OpenTelemetry, the open standard many tools build on, defines ratio-based samplers in its SDK specification, such
as
TraceIdRatioBased, which the specification is replacing withProbabilitySampler. Samplers like these make the decision as early as possible, when the trace starts.
All three samplers, set up this way, use head sampling: they decide at the start of the session, before anyone knows whether it will fail. This is why the odds above are pure chance.
Why tail-based sampling on errors alone misses agent failures
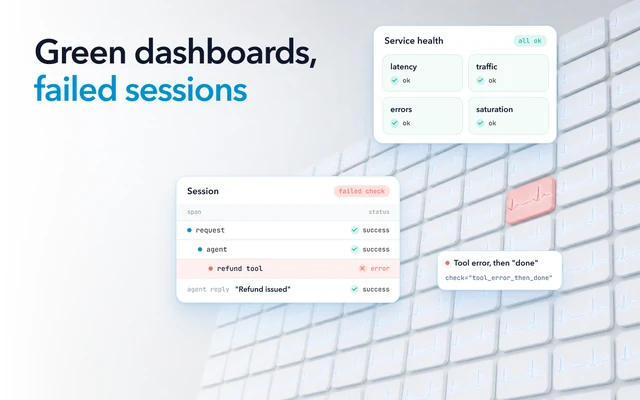
An error rule keeps only the failures something marked as an error, and many agent failures are never marked.
The alternative to head sampling is tail sampling, also called tail-based sampling. Instead of deciding at the start, tail sampling waits until it has seen the trace, and then keeps it if the trace matches a rule you set. A common rule is "always sampling traces that contain an error". The OpenTelemetry Collector, a service that receives traces and forwards them to your tools, can do this with its tail sampling processor.
That rule works well for failures that show up as errors, such as an exception or a 500 response. Set the span status to ERROR yourself for failures your code can detect, such as a tool call that failed or a model response that was not valid JSON.
But agents fail differently. An agent can call the wrong tool, go around the same loop five times, or give a confident answer that is wrong. In all of those cases, every model call and every tool call can still return success. Openlayer, which sells testing and monitoring for AI systems, describes it this way: "The status was 200. And the result was wrong." Since nothing reported an error, an error rule has nothing to catch. If that is your only rule, the session is dropped at random like any other.
Tail sampling also has two practical limits for agents.
- It needs every span of a trace in one place. All the spans of a trace must reach the same Collector instance. If you run more than one Collector, you need a load-balancing layer in front that sends every span of a trace to the same one.
- It decides on a timer. In the Collector's default mode, as of October 2026, it
makes its decision 30 seconds
after it receives a trace's first span. An agent session can take several minutes, so the decision may be made
before the rest of the session has arrived. You can soften this by raising
decision_waitabove your longest normal session and setting a decision cache for both keep and drop decisions, so spans that arrive late follow the first decision. A longer wait also means more traces held at once, and a trace pushed out of the buffer before its wait ends is dropped without sampling, so sizenum_tracesfor it too. All of this costs memory.
How to keep the session you need
Keep every session if your tool's pricing allows it
Keeping every session is the only way to be sure sampling has not thrown away the one a customer complains about. So before you accept sampling as the price of tracing, work out what keeping everything would cost.
Start with how many spans or traces your agents produce in a month, whichever unit your tool bills by. Multiply that by your tool's price for that unit. Then add any separate charge for keeping data longer than the plan includes. That gives you the monthly cost of keeping every session.
At low volume, the answer is usually to keep everything. OpenTelemetry's own sampling guide says you may not need to sample if you generate "tens of small traces per second or lower".
If you must sample, check every session first
If keeping everything is too expensive, change the order of the decision. Instead of deciding at random when a session starts, check every session as it finishes, and then decide.
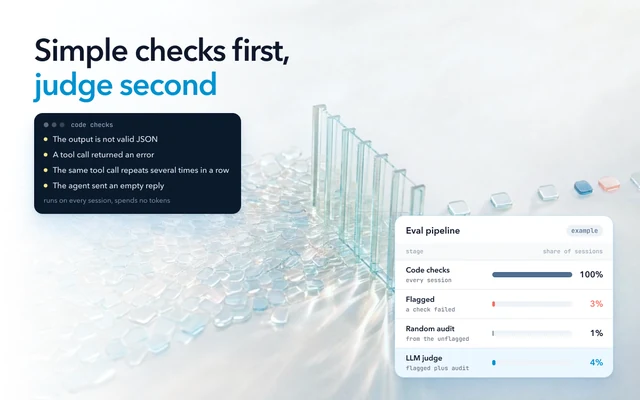
Simple rules can catch a lot of agent failures without calling a model. For example, you can flag a session when:
- it called the same tool many times in a row
- one of its tool calls failed
- it used far more tokens than a normal session
- the conversation stalled with no answer.
Keep every session that any of these four rules flags, plus a random share of the rest. For this to work, the rules have to see every session before anything is thrown away, so leave your SDK's own sample rate at 1. A trace dropped in the SDK never reaches the rules.
If you run the OpenTelemetry Collector, its tail sampling processor can apply simple versions of these rules. Langfuse's SDKs cannot tail-sample on their own (as of November 2025), and a Langfuse maintainer points users to a Collector for it.
This example keeps every trace with an error, every trace that took longer than 240 seconds (set above a normal session), and 10% of the rest. It covers only
errors and slow sessions: the other rules (repeated tool calls, token outliers, stalled conversations) need attributes
your code sets on the spans. The processor runs only once it is listed in the traces pipeline, which is the service
block at the end.
processors:
  tail_sampling:
    decision_wait: 300s     # starting point: longer than your longest normal session
    num_traces: 200000      # traces held while they wait; size for your volume
    decision_cache:         # much larger than num_traces
      sampled_cache_size: 1000000       # remembers keep decisions
      non_sampled_cache_size: 1000000   # remembers drop decisions
    policies:
      - name: keep-errors
        type: status_code
        status_code: {status_codes: [ERROR]}
      - name: keep-slow-sessions
        type: latency
        latency: {threshold_ms: 240000}   # above a normal session, below decision_wait
      - name: sample-the-rest
        type: probabilistic
        probabilistic: {sampling_percentage: 10}

service:
  pipelines:
    traces:
      receivers: [otlp]       # your existing receiver
      processors: [tail_sampling]
      exporters: [otlphttp]   # your existing exporter
These rules will not catch everything. The wrong refund amount the customer reported can look like a normal session to all four. Catching it takes a check against your own data, such as comparing the refund to your policy, or a model that judges the answer. If the session was kept, you can still find it when the customer reports it.
Count every session, even the ones you drop
If you keep every failed session but only 10% of the successful ones, your traces will make failures look more common than they are, close to ten times more when failures are rare. A true failure rate of 1% shows up as about 9%.
Count every session before any sampling happens: how many sessions there were, how many failed, how long they took and what they cost. The failed count covers the sessions that errored and the ones your checks flagged, each only as complete as its check.
Keep those counts as metrics, separate from the traces. Datadog's APM, for example, calculates its trace metrics on all traffic, as long as sampling happens at or after its Agent and not in the SDK. Langfuse and LangSmith apply their sample rate in your code, so if you sample with them, you count sessions yourself. Then use the metrics for rates and trends, and the traces for looking into individual sessions.
Keep your own record of what the agent did
If you need to track cost, audit what an agent did, or recover from a failure, do not rely on sampled traces. As one answer on the LangChain forum puts it, you should "treat the trace as explanatory, not authoritative for recovery."
Instead, keep your own small record of every model call in your own database. It does not need the full prompt and response. One row per call, with the request ID, the model, the tokens used, the cost, the status and the time taken, is enough to track cost and errors reliably. If you do keep prompts or responses, redact personal data first, because both can hold what your users typed.
Write that record through a different path from your traces. If you see "fetch failed" errors when your service sends
traces, your trace exports are failing, and some traces may never reach the tracing tool. In Node, "fetch failed" is a general network error, and
the reason is in the error's cause, so check
the connection and the exporter, not your sampling settings. One fix is to run an OpenTelemetry Collector next to your
service, so your code sends traces to a local address and the Collector handles delivery. Either way, the record you
count costs from should not depend on traces arriving.
Do not wait for an incident to turn the rate up
Raising the sample rate to 100% after something goes wrong helps you see the next failure. But it cannot bring back a session that was already dropped. If a session is worth debugging after an incident, it is worth keeping before one.
Why keeping every session is affordable in Oodle
Teams sample to control cost, and in Oodle keeping every session is affordable because of how Oodle is built. Traces go straight to object storage in Oodle's own columnar format, and queries run on serverless compute that spins up per query and shuts down after. With Oodle, every session is kept in full for your retention period (30 days on Pro, longer for an added fee), so you do not need tail sampling or your own session counts to keep the bill down.
Oodle is observability built for AI agents. Every session is analyzed at scale using statistics, ML classifiers and a small model for sentiment. Oodle's agent then checks each issue it finds against the evidence and removes the noise. As each session arrives, Oodle marks issues such as tool failures, loops, outages and stalled conversations.
Some failures, like a wrong answer, need an LLM judge, which is slower and costs money for every session it reads. So some teams run their judge on a small random share, such as 1%. In Oodle, the simpler checks pick the sessions the judge reads, so the judging goes where failures are most likely. And because every session is kept, a failure the checks missed is still there when a customer reports it.
Fello, a real estate technology company, keeps every agent session this way today. Ashish Gupta, Principal Engineer at Fello, says "We're already running 6M+ agent traces/day on Oodle with full visibility and zero sampling". Once every session is kept, the session behind tomorrow's complaint is there. You can open agent sessions like it in the Oodle playground without signing up.