Put the whole request on one trace
The trace you want starts at the API request your service received. That request span is the root. Its child is the agent's run, the agent's children are each model call and each tool call, and each tool's children are the HTTP calls and database queries the tool made.
These are the common ways that tree breaks apart or leaves part of it blank.
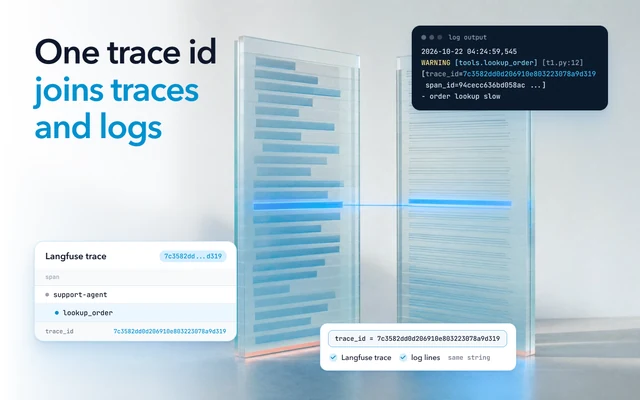
- A call to another service starts a new trace. A call joins the caller's trace only when the trace context travels with it. With context propagation, the caller sends its trace ID and span ID, and the service it calls makes its own span a child of the caller's span. OpenTelemetry's instrumentation libraries usually handle this, but a custom transport needs it done by hand.
- The work inside the tool has no spans. Agent frameworks usually time the tool call, not the work inside it. The OpenAI Agents SDK, for example, wraps each model generation and each function tool call in a span by default, and you add a custom span for anything inside the tool, such as a database call. OpenTelemetry's GenAI conventions also encourage developers to instrument tool calls by hand where automatic instrumentation does not cover them, because tools often run in the application's own code.
- The spans go to different places. An LLM tracing SDK may export only the model-related spans of a request. Langfuse's SDK, for one, exports the LLM-relevant spans by default unless you set a permissive filter, so with that default the database span of the same request does not reach it.
What each span needs to record
Each span needs a name you can group by and the few attributes that explain its duration. OpenTelemetry's semantic conventions name each step of an agent request. The table gives them as of October 2026.
| Step | Span name | What to record on it |
|---|---|---|
| API request | Your HTTP server span, such as POST /api/chat |
Route and status |
| Agent run | invoke_agent {gen_ai.agent.name} |
Agent name |
| Model call | {gen_ai.operation.name} {gen_ai.request.model}, such as chat gpt-4.1 |
Model, gen_ai.usage.input_tokens and gen_ai.usage.output_tokens, and for a streamed response gen_ai.response.time_to_first_chunk |
| Tool call | execute_tool {gen_ai.tool.name} |
Tool name and status |
| Retrieval from a vector database or search system | retrieval |
gen_ai.retrieval.top_k |
| Database query | {db.query.summary}, such as SELECT tickets |
db.system.name, db.operation.name and db.query.summary |
The GenAI names in that table are not settled. OpenTelemetry moved its GenAI conventions into a repository of their own, and as of October 2026 they are all at Development status.
Some names have already changed. The
GenAI metrics page
now says gen_ai.client.operation.duration should not be reported for model inference, and points to
gen_ai.client.inference.duration instead. Instrumentation written before that change may still emit the older name.
Check what your own instrumentation emits before you build a dashboard or an alert on any of these names.
The database names are more settled. OpenTelemetry's
database span conventions are Stable, and raw
query text is not collected by default unless it is sanitized. db.query.summary is a low-cardinality summary of the
query and the span name, which makes it the field to group queries by.
Reading one slow trace
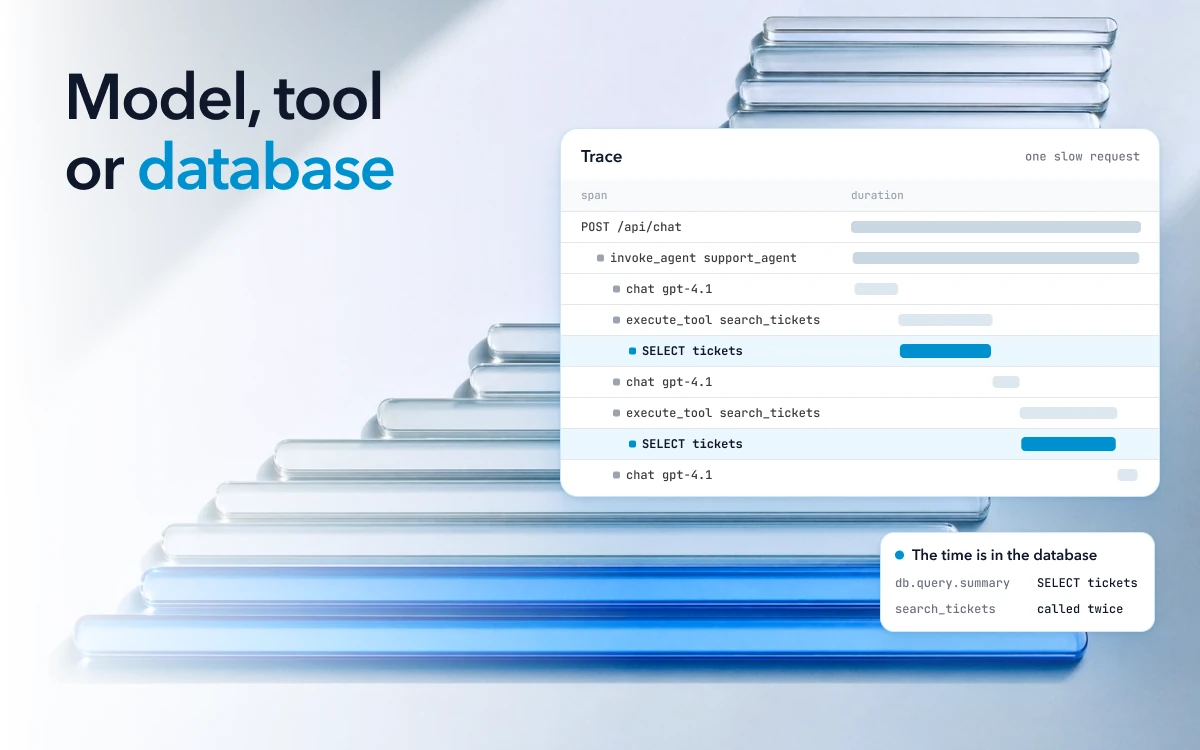
Once the spans are in one trace, read it from the root down. First check that the root is the API request and that no span points to a parent missing from the trace, which means a hop that did not join or was sampled out. Here is a support agent's request as a span tree. The timings are an illustration chosen to show the reading, not a measured run.
POST /api/chat                          8.6 s
└─ invoke_agent support_agent           8.5 s
   ├─ chat gpt-4.1                      1.3 s
   ├─ execute_tool search_tickets       2.8 s
   │  └─ SELECT tickets                 2.7 s
   ├─ chat gpt-4.1                      0.8 s
   ├─ execute_tool search_tickets       2.9 s
   │  └─ SELECT tickets                 2.8 s
   └─ chat gpt-4.1                      0.6 s
The agent span is 8.5 seconds, but that does not make the agent slow. A span's self time is its duration minus the time its children cover. The agent's children add up to 8.4 seconds, so the agent's own code took 0.1 seconds. The same sum on each tool span leaves 0.1 seconds for the tool's own code, and the rest is the query under it.
So the time is in the database. The two queries take 5.5 of the 8.6 seconds, and the three model calls take 2.7. The
trace also shows why the query ran twice: the agent called search_tickets a second time. That gives two things
to look into: why each query is slow, and whether the agent needed to repeat the call.
In this trace every span runs after the one before it. When an agent runs tools in parallel, the request waits only for the slowest of them. The critical path is the chain of spans the end of the request waits on. A span that is not on the critical path can get faster without the request getting any faster.
Also look for gaps and repeats. A gap is self time you can see in the tree: time inside a parent
that none of its children covers. It usually means code with no span of its own, work waiting in a queue, or a lock
or a runtime pause. A repeated span, like the second search_tickets call above, can mean a retry or a loop in the
agent, so check its arguments against the first call.
You know where the time went when every second of the root span is accounted for, either by a span or by a gap you can name. In the example, 8.6 seconds splits into 5.5 in the database, 2.7 in the model, 0.2 in the tool code and 0.2 in the agent and the API handler.
Telling LLM latency apart from agent and infrastructure time
Model time shows in the model spans, agent time in the number of steps and the agent's self time, and infrastructure time inside the tool spans.
| What the trace shows | Where the time went | What to check next |
|---|---|---|
| Model spans take most of the request, with a long time to first chunk | Before the model started writing: the provider's queue, or reading a long prompt | Input tokens per call, and whether a retry is inside the span |
| Model spans are long after the first chunk | The model writing a long answer | Output tokens per call |
| Each span is short, but there are many, or the same tool call repeats | The agent's behavior: extra steps, loops, repeated calls | Model and tool calls per request, against a fast request of the same kind |
| The agent span has a lot of self time | Agent code with no span of its own | Add spans to that code |
| A tool span is long, and a query or HTTP span under it is long | The database or the service the tool called | The query's plan, or the called service's own spans |
| A tool span is long, and nothing under it is | Code inside the tool with no spans, or a call that did not join the trace | Instrument the tool, and propagate context to the service |
| Time at the root or between spans that no child covers | Queueing, a worker pool or code with no span | Queue and worker metrics for that window |
Time to first chunk is how long a streamed response takes to send back its first piece. OpenTelemetry's GenAI
conventions name it, on the client span,
gen_ai.response.time_to_first_chunk,
measured from the start of the call, before the first attempt, so failed attempts and the waits between retries count
toward it. The rest of the model span is mostly the model writing, plus delivery of the
remaining chunks.
On the model server, a separate metric, time to first token, helps measure "the time spent in the queue and the prefill phase", and the prefill phase is the model reading the prompt. So a long time to first chunk with a short answer points at waiting, retries or a long prompt. A short time to first chunk followed by a long span points at the length of the answer.
A long model span is not always a slow model, though. A GenAI span is meant to cover the whole operation with all its retries when the client retries automatically. If your client retries on rate limits, one long model span can be two or three attempts. Check the client's retry count or the provider's rate-limit errors before you blame the model.
Pod CPU and memory help once the trace has named the service to look at, and not before. Twelve seconds of latency against flat pod metrics usually means the process spent the time waiting, on the model, a downstream call or a connection, and not computing, once you have ruled out CPU throttling.
When the database team and the trace disagree
Both can be right: the trace measures the call as your service saw it, and the database measures only the query. So a query the database team times in milliseconds can sit inside a retrieval span of seconds.
A database client span covers the call "as observed by the caller", and when the call was retried, it covers "the duration of the logical operation with all retries". OpenTelemetry's GenAI spans, retrieval included, are defined the same way. The database's own number is the time it spent running the query. So the difference is time outside the query: the network, waiting for a connection from the pool, and retries. A retrieval span can also hold work besides the query, such as embedding the question or running several queries.
To confirm it, put a span around getting a connection from the pool, or read the pool's wait metrics for the same window. If the gap stays after that, look at the network between the service and the database.
Finding what adds AI agent latency across many requests
To find which agent or tool call adds latency across your traffic, group span durations by agent, then by span name,
and compare p50 and p95 for each tool, each model and each agent. OpenTelemetry's GenAI conventions define histograms
for this,
such as gen_ai.execute_tool.duration and gen_ai.invoke_agent.duration,
at the same Development status as the span names.
Keep agents that do different work apart. A p95 across a quick lookup agent and a slow research agent describes neither of them, and an agent that retries one step three times disappears into the blend. Group by agent first, then by span name inside each agent.
Then compare a slow request with a fast request from the same agent with similar input. The difference is usually a span that got longer or a span that appears more times. After a deploy, compare each span name's p95 and its count per request before and after it, which tells you whether the model, a tool or a query changed.
Seeing the model, the tool and the query in one Oodle trace
In Oodle, agent traces live on the same platform as logs, metrics, traces, APM and real user monitoring data. A tool that traces only model calls needs a second product to show the database query under a tool call. When each service passes the trace context on, one trace runs from the API request through the agent and its tools to the database. When an agent is slow or wrong, the step that caused it is in that trace.
In Oodle's trace view, hovering over a span's duration compares its latency with the same span across other traces. That tells you whether a slow query in one request is unusual or is how the query always behaves. Oodle's agent traces page shows a trace where the slow step is the database query under a tool call. Oodle shows each step's self time and the slowest path through a session.
To start, send one slow request's spans to Oodle over OpenTelemetry, from the API handler down to the query, and check that they arrive as one trace.