Why a wrong answer in a multi-step agent hides the step that caused it
Unless something checks the data where one step hands it to the next, an agent does not stop when a step produces bad data. The next step treats that data as true and builds on it. By the time the answer comes out wrong, the step that caused it can be several steps back. A developer on r/LocalLLaMA put it this way: "when something breaks at step 4, I have zero visibility into what actually happened at step 2."
So the wrong answer tells you that something broke, but not where. To find where, you need a trace of the whole session. A session is one conversation or task the agent handles from start to finish, and its traces have to hold every step with what went into it and what came out.
What the trace has to hold for agent debugging to work
For the walk to work, the trace has to hold every step, which step started which, and what went into and came out of each. Your tracing tool turns each step into a span, and each span names the span that started it, called its parent. Those parent links make the spans a tree, with the agent at the top and its model calls and tool calls nested under it.
OpenTelemetry's semantic conventions
recommend names for these spans.
An agent's span is invoke_agent followed by the agent's name,
and a tool call's span is execute_tool followed by the tool's name.
When one agent calls another, the second agent gets
its own invoke_agent span
inside the first. As of October 2026 these conventions are
still in development,
and some frameworks name their spans differently.
The tree shows which step started which. It does not show which output fed which input. For a tool call, the tool
call id makes that link. The execute_tool span carries
the tool call identifier supplied by the model
(gen_ai.tool.call.id), so you can match the model's request for a tool to the span where that tool ran.
To see which step was wrong, you also need what each step was given and what it returned. Whether you get that
depends on the tool. Langfuse's @observe()
captures inputs and outputs by default. LangSmith keeps
them unless you set it to hide them, and the OpenAI Agents
SDK includes them by default. If they are missing in one of
these, a setting has turned them off.
If you instrument with OpenTelemetry, the standard's semantic conventions go the other way. Instrumentations should not capture prompts, tool inputs or tool outputs by default, and should let you opt in, because that content is sensitive and often large. So with instrumentations that follow these conventions, a trace can show that a tool ran and succeeded without showing what it was asked or what it said.
In OpenTelemetry's Python GenAI instrumentations, an environment variable turns content capture on. As of October 2026 the value depends on which version of the conventions you have opted into. Other instrumentations have their own setting.
# Default conventions
export OTEL_INSTRUMENTATION_GENAI_CAPTURE_MESSAGE_CONTENT=true

# Latest experimental conventions
export OTEL_SEMCONV_STABILITY_OPT_IN=gen_ai_latest_experimental
export OTEL_INSTRUMENTATION_GENAI_CAPTURE_MESSAGE_CONTENT=span_only
Turning capture on puts prompts and tool results into your traces, so decide first what must not leave your application. Redact sensitive fields before they are sent. For production, OpenTelemetry's conventions also describe keeping the content in separate storage with its own access controls, and putting a reference to it on the span.
How to debug AI agent failures by walking back from the wrong answer
Follow the data back from the answer
Start from the wrong answer and follow the data backward. Reading a long trace from the first span to the last means reading every step to find one.
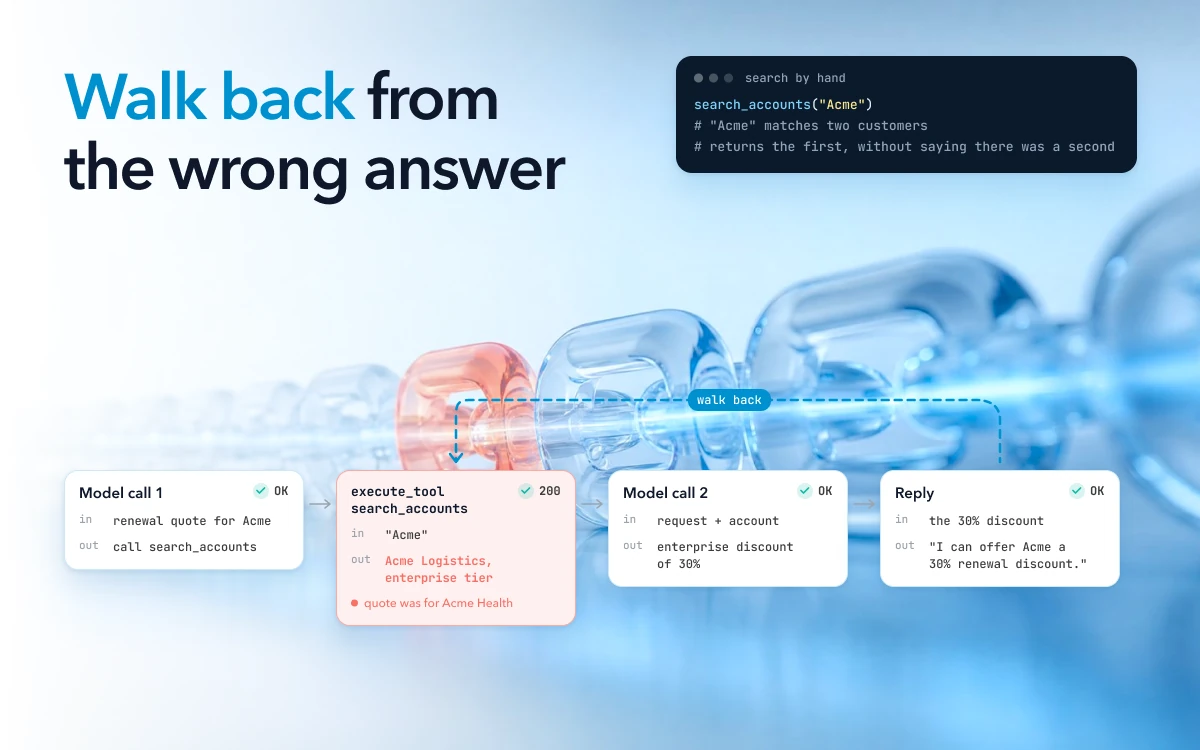
Ask what the final answer was based on. Go to the step that produced that input, and check whether its output was right for what it was given. If it was, the fault came from earlier, so move back to the step that produced those inputs. The step you want is the first one whose output was wrong even though its inputs were right.
Take a sales agent, for example. A rep asks it for a renewal quote for "Acme", and it offers a 30% discount. Acme Health should have been offered 10%. The trace holds four steps.
| Step | What went in | What came out |
|---|---|---|
| Model call 1 | The rep's request for an Acme renewal quote | Call search_accounts with "Acme" |
execute_tool search_accounts |
"Acme" | One account: Acme Logistics, enterprise tier |
| Model call 2 | The request and the account the search returned | Apply the enterprise discount of 30% |
| Reply | The 30% discount | "I can offer Acme a 30% renewal discount." |
Walking back, the reply matches model call 2. That call applied the right discount for the account it was given, so look at where the account came from. The rep only said "Acme", so model call 1 was right to search on the name. The search result is the first thing that looks wrong: it returned Acme Logistics, and the quote was for Acme Health.
Running the same search by hand shows why. "Acme" matches two customers, and the tool returns the first one without saying there was a second. So the search step broke, even though it returned a 200 and a well-formed result. The trace made this quick to find, because it held what each step was given and what it returned. Without the tool's output, the search would be just a green span.
The walk finds a step that produced bad output. A step that should have run and did not has no output to find. When every step's output looks right for its input, compare what the request needed with the steps that ran.
When several agents hand work to each other
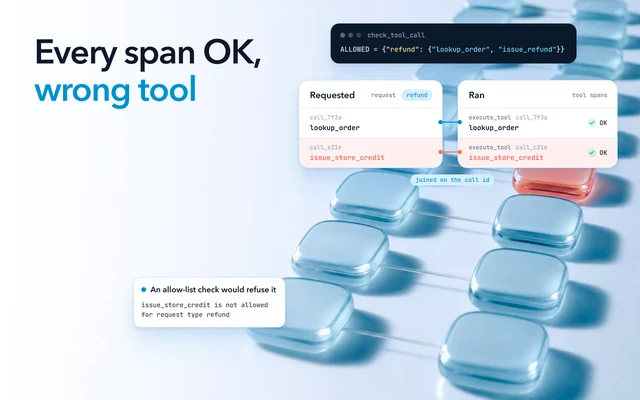
With several agents, the same walk runs agent by agent. Check the input and the output at each handoff, and look for the first agent that turned a good input into a bad output. That is often not the agent that gave the final answer. A feature request on Arize Phoenix's tracker gives an example: "Every span is status=OK. Final answer is wrong. Naive blame points at execute_sql. Real blame is Agent A."
Agent frameworks give you the handoffs to check. The OpenAI Agents SDK
wraps each handoff in its own span, and in OpenTelemetry's
conventions each agent that another agent calls gets
its own invoke_agent span
under the caller.
A person still has to walk those handoffs, because automatic attribution is not reliable yet. In a 2025 study of failure logs from 127 multi-agent systems, the best method tested named the responsible agent 53.5% of the time and the step where the failure began 14.2% of the time. When a user asked for a general utility to assign the blame, the tool's maintainers declined because "Root-cause attribution depends heavily on the application's architecture, telemetry, and definition of failure".
Narrowing a long trace before you walk it
A long session can have hundreds of spans, so narrow it before you walk it. Filter the spans by status, duration and name. Spans that failed, were retried or took longer than usual are good places to start, but treat them as leads. In a session like the Acme quote, where every step succeeded, a status filter finds nothing. Filtering by tool name or by the account involved still narrows it, and then you follow the data back from the answer.
Rerunning the suspect step
Once you have a suspect, test it. "Replay" can mean three different things, and they answer different questions.
- Running one step again with its captured inputs. You send the same prompt to the same model and see what it does. Models do not always give the same answer twice, so run it several times before you draw a conclusion.
- Running the agent with captured results up to the suspect. Your test harness feeds the captured model responses and tool outputs back in for every step before the suspect, so those steps get exactly what they got the first time. Then the suspect runs live with your fix. This tests the fix on the broken step without earlier steps taking a different path.
- Playing a session back to read it. Langfuse's session replay shows a whole conversation in order. It helps you read the session, but it does not run anything.
All three depend on the trace holding each step's inputs and outputs. Once the fix works, keep the session as a regression case, so the next change to a prompt or a tool is tested against it.
Why some steps never show up in the trace
A step that ran is usually missing because nothing wrapped it in a span, it lost its link to the session, a setting turned tracing off, or the process ended before the spans were sent. The walk back stops at any step that is not in the trace. No tool can find a step that was never instrumented, so the fix is in your code or your tracing setup.
| Cause | What you see | The fix |
|---|---|---|
| Nothing wrapped the step in a span | The step is missing, but its effect shows up in later steps | Wrap it: @observe() in Langfuse, @traceable in LangSmith, tracer.start_as_current_span() with the OpenTelemetry SDK |
| The step lost its link to the session | The step shows up as a separate trace | Pass the trace context to it, as described below |
| A setting turned tracing off or stripped the content | The span is missing, or present with its inputs and outputs stripped | Look for settings such as OPENAI_AGENTS_DISABLE_TRACING, LANGSMITH_HIDE_INPUTS, or capture_input=False on a Langfuse @observe() |
| The process ended or was frozen before the spans were sent | The last steps of serverless functions and some worker pools are missing | Flush before the process ends: force_flush() on the OpenTelemetry tracer provider, langfuse.flush() in Langfuse, or flush_traces() in the OpenAI Agents SDK |
The second cause is the hardest to spot. A span finds its parent through context, which is the information that says
which trace and which span are current. In Python, OpenTelemetry's Python API keeps that information in a context variable, which
follows the code as it runs. An asyncio task
copies the context when it is created, so tasks keep their
parent, and asyncio.to_thread
carries it into the thread for you. A thread pool does not.
Work sent through ThreadPoolExecutor.submit or loop.run_in_executor starts with no current span and becomes the
start of a new trace.
One Langfuse user reported that symptom with
a LlamaIndex tool that was not traced. Adding @observe made the
tool appear, but
"it creates a completely separate entry in my traces" instead of
showing up under the agent. A Langfuse contributor suspected LlamaIndex's thread pools and
pointed to carrying the context into worker threads.
That put the tool in the same trace, but for that user it was "only appended at the very end of it, outside of the Agent Loop", and the issue was still open in October 2026. Carrying the context is needed, but it is not always enough.
You can carry the context by hand, with a fresh copy of the context for each task you submit. Reusing one copy for two
tasks running at once raises a RuntimeError.
import contextvars
from concurrent.futures import ThreadPoolExecutor

with ThreadPoolExecutor() as pool:
    ctx = contextvars.copy_context()   # one copy per task
    result = pool.submit(ctx.run, search_accounts, "Acme").result()
Or let a library do it. OpenTelemetry's threading instrumentation, ThreadingInstrumentor().instrument(), carries the
context into every thread, and Langfuse's docs recommend it.
LangSmith has its own
ContextThreadPoolExecutor.
When a step runs in another process, such as a background job or a consumer reading from a queue, the context has to travel with the message. OpenTelemetry's propagators do that. They write the trace context into the message's headers on the way out and read it back on the way in.
Finding the failing step in thousands of log lines
Put the session ID, step ID, parent step ID and attempt number on every log line, so one search pulls a session out of thousands of lines. Without them, chained tools and retries are hard to follow in the logs. An SRE on r/Observability described going through "fifty thousand lines to find the prompt or tool call that sent things off the rails." The same engineer had already tried structured JSON logs with full prompts and responses, and found they became "its own archaeological dig".
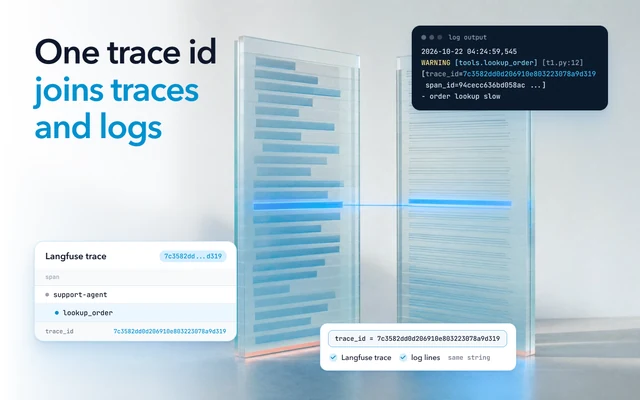
The links between steps are what make logs searchable, so give every log line the same tree a trace has, and log how each attempt ended. If you also have traces, add the trace ID, so one search finds both the session's log lines and its trace.
{"level": "WARN", "session_id": "sess_8f2c", "trace_id": "4bf92f3577b34da6a3ce929d0e0e4736", "step_id": "s2", "parent_step_id": "s1", "step": "search_accounts", "attempt": 2, "outcome": "retry"}
Log retries at WARN and keep ERROR for the attempt that finally failed, so a search for errors returns failures and
not noise. Then a tool such as jq can pull out one session, or only the final failures. The fromjson? form skips
any line that is not JSON, so a stray plain-text line does not stop the search.
jq -cR 'fromjson? | select(.session_id == "sess_8f2c")' agent.log
jq -cR 'fromjson? | select(.level == "ERROR")' agent.log
For a session where nothing failed, like the Acme quote, pull the whole session by its ID and follow the data back, as you would in a trace.
Catching a bad step before later steps build on it
Check the data each time one step hands it to the next, so bad data is caught at the step that made it, before later steps build on it. Check what a tool returned, what a model asked a tool to do, and what one agent passed to another.
- Checks on shape ask whether the data looks right. Does the JSON have the fields you expect, and is the total a positive number? These are easy to write, but they would not have caught the Acme quote, because Acme Logistics was a real account with every field filled in.
- Checks on sense ask whether the data fits this request. Did the search find more than one account for the name? Does the account belong to the rep who asked? Is the discount within what the rep's role can offer?
A check on sense has to see what it is checking. In the Acme case the search tool kept the first account and dropped the second, so no check after it could have seen two matches. The check belongs inside the search tool, over every account it found. A tool that quietly picks one result, or fills in a default such as an empty list or "unknown", is itself the failure to check for. Once the agent knows the account's id, it can look the account up by id and skip the guess.
When a check fails, mark the span as failed with a message that says why, so the next person who opens the trace is pointed at this step. Then decide what the agent does next. It can retry, ask the user to choose, or stop. In the Acme case, the search tool counts every account that matched and asks the user to choose when the count is not exactly one.
from opentelemetry import trace
from opentelemetry.trace import Status, StatusCode

tracer = trace.get_tracer(__name__)

def search_accounts(name):
    with tracer.start_as_current_span("execute_tool search_accounts"):
        matches = find_accounts_by_name(name)  # every match, not only the first
        return check_account_matches(name, matches)

def check_account_matches(name, matches):
    if len(matches) == 1:
        return {"status": "ok", "account": matches[0]}
    trace.get_current_span().set_status(
        Status(StatusCode.ERROR, f"{len(matches)} accounts matched {name!r}")
    )
    return {"status": "ask_user", "matches": [m["name"] for m in matches]}
Before a step that changes something outside the agent, such as sending a message, charging a card or deleting data, a failed check should stop the session there. The agent stops the action and asks the user, or waits for a person to approve.
Limits on the whole session help too: a maximum number of steps, a cap on tool failures in a row, and a stop when the same tool keeps being called with the same arguments. Limits stop the damage from spreading. The checks on shape and sense are what point at the step that caused it.
Keeping the session you need to walk back
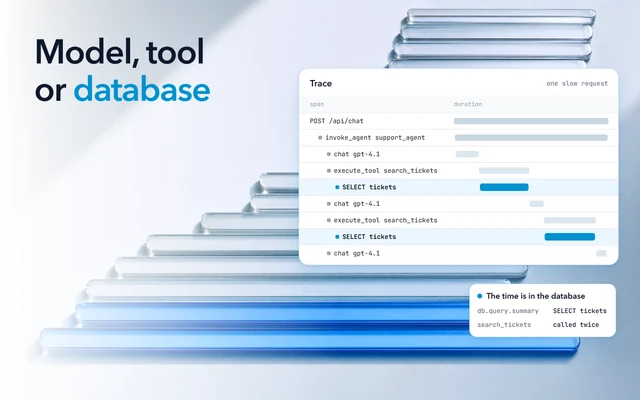
In Oodle, every session is kept in full for your retention period (30 days on Pro, longer for an added fee). That is affordable because of how Oodle is built. Traces go straight to object storage in Oodle's own columnar format, and queries run on serverless compute that spins up per query and shuts down after. One trace runs from the API request through the agent and its tools to the database, once your services pass trace context to each other and your database client sends spans. That is what the walk needs: a kept session whose trace reaches the broken step.
Every session is analyzed at scale using statistics, ML classifiers and a small model for sentiment. Oodle's agent then checks each issue it finds against the evidence and removes the noise. Sessions with tool failures, loops, outages or stalled conversations are flagged before anyone opens them. Tracing shows only the steps your code sends, and a result like the Acme search still needs your own check. The Oodle playground has agent traces to walk, with no login.