Why adding workers stops fixing a struggling tracing setup
Past the point where the worker is the bottleneck, the load lands on ClickHouse, which every worker reads from and writes to, so more workers stop helping. Before you add them, find out which component is saturated.
Start with the worker itself. Langfuse's minimum for a worker is 2 CPU and 4 GiB of memory, as of October 2026.
Langfuse's rule is that a 2-CPU worker running above 50% CPU is saturated and you should add containers. That threshold is low because the worker runs on Node.js, which does most of its work on one thread. A Langfuse engineer put it this way in July 2025: "a CPU utilization of ~60% can be considered fully utilized" on a 2-CPU pod.
Langfuse also publishes a queue metric, and langfuse.queue.ingestion.depth with the tag type:waiting is the one it scales on, from v3.169.0. That version emits it to StatsD only, and CloudWatch needs v3.170.0. Older versions use langfuse.queue.ingestion.length. A growing queue tells you the workers are behind, whatever the CPU graph says.
Check memory as well as CPU, because workers can run out of memory while CPU looks idle. One team on v3.106.1, at around 441,000 traces a day in September 2025, saw worker memory above 90% while CPU stayed around 10%. An autoscaler watching CPU alone would not have added a single worker. In January 2026, on v3.132.0, the same reporter wrote that with Redis and S3 working normally, "there are no issues with our worker/web containers".
In another thread, a worker was OOM-killed with a 512 MiB memory request, and Langfuse answered that it sees about 2.5 GiB per worker in its own cloud and recommends at least 4 GiB. Months later, in June 2026, a different user in the same thread wrote that "we increased the number of worker pod to 21 , still it is restarting".
Once each worker has its memory, look at what all of them share. By default, the worker reads the existing event from ClickHouse and merges it with the incoming data, which Langfuse says "may limit the total throughput". For projects that were never migrated from an earlier Langfuse version, the full event history is already in S3, so you can skip that read by setting LANGFUSE_SKIP_INGESTION_CLICKHOUSE_READ_MIN_PROJECT_CREATE_DATE to a date before your first project was created.
One July 2025 report shows where the load goes next. A team ingesting heavily on Kubernetes had web pods restarting even with 4 pods of 2 CPUs and 4 GB each. On Langfuse's advice they split ingestion from the UI and ran 8 ingestion pods. Then their health checks started failing on a ClickHouse error, "Too many simultaneous queries. Maximum: 100". The containers had scaled out, and every one of them was now sending queries to the same ClickHouse. Langfuse's answer was to tune how the workers batch their writes, with LANGFUSE_INGESTION_CLICKHOUSE_WRITE_BATCH_SIZE and LANGFUSE_INGESTION_CLICKHOUSE_WRITE_INTERVAL_MS.
Splitting is still worth doing. When ingestion is heavy, Langfuse says the web interface and API calls may become slow or unresponsive, and a separate ingestion deployment keeps the UI responsive. But after the workers are sized, split and keeping up with the queue, the next limit is ClickHouse.
Why the Langfuse trace list times out once you have millions of traces
A trace list that times out is usually reading more rows than it shows. Langfuse indexes its tracing data by project and time, so the first fix is a time range on every trace list, search and list query through the API. The second is a bigger ClickHouse: Langfuse recommends at least 16 GiB of memory for larger deployments, as of October 2026.
Filters on other columns, such as the trace name or environment, are not covered by that index. One user on v3.162.0, in March 2026, found that searches failed whenever the dataset exceeded tens of millions of records. At 16 million records, the user wrote, "neither the SQL nor the UI could return any results". After adding ClickHouse skip indexes on the environment and name columns, the same query on 4 million traces went from over 20 seconds to 2 seconds.
Langfuse's reply pointed to its newer observations v2 endpoint, which it called "more performant and reliable than the traces endpoint".
Adding indexes to Langfuse's tables yourself can work, but it has a cost. Langfuse tests its ClickHouse schema as a unit with each release, and once you change a table definition, "keeping it compatible with future upgrades becomes your responsibility".
Other self-hosted tools have had the same problem. In January 2025, a Phoenix user's trace list became "increasingly slow relative to the number of traces", even though the list was paginated. Phoenix fixed it in March 2025 by loading only the attribute values the list needs, not whole spans.
If you are still on v3, the read path you are tuning has since changed. In v4, one denormalized observations table replaces read-time joins between traces and observations. The reports above predate that change, so test your own slow queries on v4 before you tune around them.
What "Database resource limit exceeded" on a dashboard is telling you
This error means ClickHouse stopped the query when it hit a resource limit, not that it ran slowly. The message on self-hosted Langfuse reads "Database resource limit exceeded. Please use more specific filters or shorter time range.", and the message is the first fix: narrow the dashboard's filters and time range.
If narrow queries still hit it, give ClickHouse more resources. When users reported the error after upgrading to v3.127.0 in November 2025, a Langfuse engineer asked, "what happens if you upgrade the clickhouse nodes and give them more memory?". In a parallel report on v3.122.0, Langfuse's first guess was that "there aren't enough resources allocated to your clickhouse instance". The reporter answered that ClickHouse had not passed 40% and was pointed to the first thread.
More hardware did not end it for everyone. One user in the first thread had already moved to CPU-optimized instances and still saw ClickHouse CPU run high after an update. Another saw the alerts "while all monitoring metrics on DB are fine".
Several reporters said the error began after an upgrade, with no change in how they used Langfuse. In March 2026, a user with over 100 million traces still saw it at 16 CPUs and 128 GB. Langfuse replied that it was "aware of the issue", recommended 128 GB or more of memory for large instances and pointed to the v4 architecture. If you are on v3, retest on v4 before you add hardware.
Langfuse can also send reads to a separate read-only endpoint with CLICKHOUSE_READ_ONLY_URL, but only on clusters that separate compute, such as ClickHouse Cloud or BYOC (Bring Your Own Cloud). On a single-node ClickHouse, the setting provides no benefit, because the endpoint would be the same as the primary. On a self-managed install, a heavy dashboard and a burst of ingestion compete for the same CPU and memory.
Why retention runs and the Langfuse ClickHouse disk does not shrink
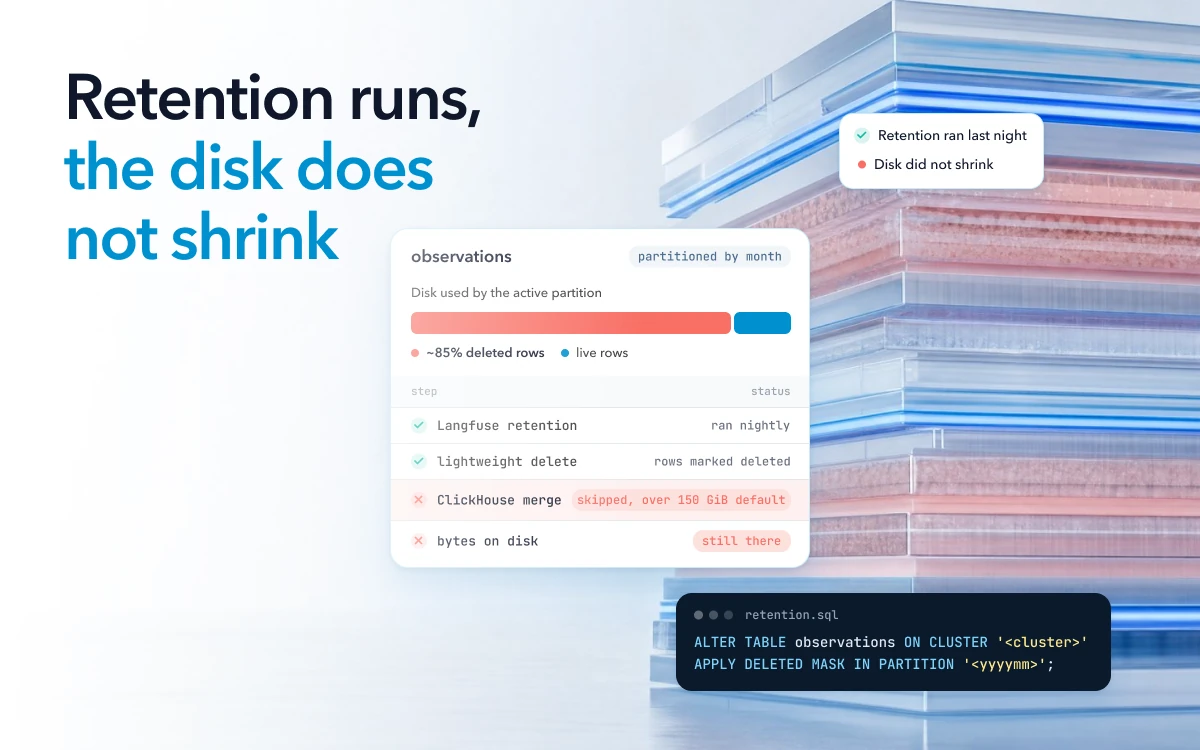
Retention can run every night and still not free the disk, because a ClickHouse lightweight delete hides rows long before it removes their bytes. ClickHouse writes a table's rows into parts, each a directory of files holding a slice of the rows, and background merges combine small parts into bigger ones. Deleted rows leave the disk only when ClickHouse merges the part that holds them, and by default it will not merge parts that add up to more than 150 GiB. On a busy install, retention keeps marking rows deleted inside parts that nothing will merge again.
Langfuse retention is a nightly job, set per project, with a minimum of 3 days, and it needs the Enterprise edition. Open-source installs that remove old rows with a ClickHouse TTL have the same problem. When a lightweight delete runs, the rows are physically removed only "during the next merge", so for "an unspecified period" they are only marked as deleted. And the default cap on the source parts of a background merge is 150 GiB, as of October 2026.
One team on v3.155.1 laid this out in June 2026. They ingested about 70 to 90 GB a day with 14-day retention, and their observations table was partitioned by month. At that rate, the month's parts reached about 150 GB within a few days and stopped being merged. Roughly 85% of the disk used by the active observations partition was rows retention had already deleted.
The fix the thread's users run is to remove deleted rows on a schedule themselves. APPLY DELETED MASK forcefully removes rows that a lightweight delete marked, one partition at a time:
ALTER TABLE observations ON CLUSTER '<cluster>'
APPLY DELETED MASK IN PARTITION '<yyyymm>';
ClickHouse calls it a heavyweight mutation, so run it off-peak. The team's last run reclaimed about 360 GiB per replica in about 17 minutes. A Langfuse contributor replied that "running it on cron is the way to go" for now, and a second user wrote in July 2026 that a cron job running it was working for them too. For a month that is entirely past retention, dropping the partition frees it without waiting for a merge, which the contributor called acceptable provided no project keeps data longer than that window.
Before you blame your traces, check what is on the disk. On self-hosted Langfuse, disk is frequently dominated by ClickHouse's built-in system log tables rather than Langfuse's own. These tables have no TTL by default, and Langfuse does not read them. This query lists the largest tables:
SELECT table, formatReadableSize(size) as size, rows FROM (
    SELECT
        table,
        database,
        sum(bytes) AS size,
        sum(rows) AS rows
    FROM system.parts
    WHERE active
    GROUP BY table, database
    ORDER BY size DESC
)
If the system logs lead, Langfuse documents switching off the ones it never reads with a file in /etc/clickhouse-server/config.d/:
<clickhouse>
    <trace_log remove="1"/>
    <text_log remove="1"/>
    <opentelemetry_span_log remove="1"/>
    <asynchronous_metric_log remove="1"/>
    <metric_log remove="1"/>
    <latency_log remove="1"/>
</clickhouse>
How to keep storage costs down on a self-hosted trace backend
Keep storage costs down with three levers: a retention window, older parts moved to object storage, and sampling only the traffic you watch for trends. Agent traces make all three matter more, because each one holds many steps. One team on v3.155.1 reported in April 2026 about 165 observations per trace and about 325 GB compressed over 66 days. Their 200 GiB volumes were "filling up rapidly".
Set a retention window first. On self-hosted Langfuse, data is stored indefinitely by default, and retention policies need the Enterprise edition. Without it, Langfuse points to ClickHouse's TTL feature for removing old rows. A TTL applies to the whole table, while Langfuse retention is set per project, so set the TTL no shorter than the longest window any project needs.
Next, move older data off the expensive disk. The team above planned a ClickHouse TTL that moves older parts to S3 after 30 days. ClickHouse can also use object storage as a disk outright, with its metadata still on a local volume. Raw events that Langfuse writes to blob storage can expire with lifecycle rules, and Langfuse suggests 30 days as a default for most customers.
Langfuse's own recommendation for larger deployments is managed ClickHouse Cloud or BYOC, which separate storage from compute so storage can grow without the compute that serves queries. A hosted service such as Oodle's is another route, with no ClickHouse for your team to size or run.
You can also sample. Langfuse keeps every trace by default, and a lower sample rate cuts storage roughly in proportion to the traces you drop. The cost is the same share: at a 10% rate, a given trace has a one in ten chance of being there when you go looking for it. Keep everything for the traffic you debug one session at a time, and sample only what you watch for trends.
Can self-hosted Langfuse hold 1M traces a day?
Whether it holds depends on your peak rate, the observations in each trace and their size, and only a load test on your own payloads tells you. One million traces a day averages about 11.6 a second, which sounds small. When a team asked for benchmarks at 10,000 requests a second, a Langfuse engineer answered that "this is very payload dependent" and advised a load test on representative workloads.
The arithmetic shows why the shape matters more than the count. At two observations a trace, 1 million traces is 2 million observations a day, or about 23 a second. At the 165 observations a trace one team reported, the same million traces is 165 million observations, or about 1,900 a second on average, before any peak. Load test with your own payloads replayed at your measured peak rate, not with synthetic one-span traces.
When the test shows you need more room, the parts scale differently. Web and worker containers are stateless, so you can add them at any time. In self-hosted Langfuse's default single-shard setup, ClickHouse scales only vertically. Shards are how ClickHouse scales horizontally, but Langfuse does not support a multi-shard cluster and its chart deploys one shard. Its guidance when you outgrow one shard is to get in touch or consider ClickHouse Cloud or BYOC. Disk grows by expanding volumes, which is why Langfuse asks for a storage class that allows volume expansion.
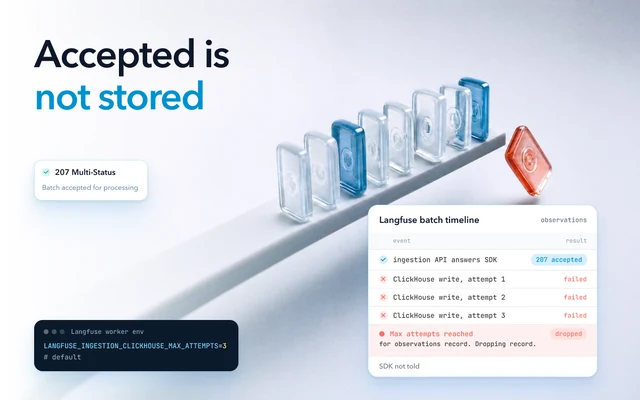
Replicas need planning too. Langfuse recommends at least 3 replicas for production, and the count cannot be increased at runtime without manual intervention or downtime. One team on v3.143 with a single replica holding 50 GB asked in April 2026 how to get to three, and "when to plan this so that the incoming traces are not lost". Add replicas while the install is small. Whether traces the API has already accepted survive a restart or migration is a separate problem from capacity, and worth testing on its own.
What changes when there is no database to run
With Oodle's hosted service, there is no shard, disk or merge schedule for you to run. Self-hosting Langfuse on its default single-shard ClickHouse leaves all of that with your team: a server to size up, disk to expand, merges and deletes to run on a schedule, and replicas to plan before you need them.
Traces go straight to object storage in Oodle's own columnar format, and queries run on serverless compute that spins up per query and shuts down after. That holds for your retention period (30 days on Pro, longer for an added fee). One query fans out to thousands of serverless invocations. The largest deployment handles 12 million agent spans a day, with P99 query latency under a second.
If you use the Langfuse SDK today, only the endpoint changes to send your traces to Oodle. Try it on a day of your own traffic, the same day you would use for a load test.