What "Max attempts reached ... Dropping record" means in the self-hosted Langfuse worker
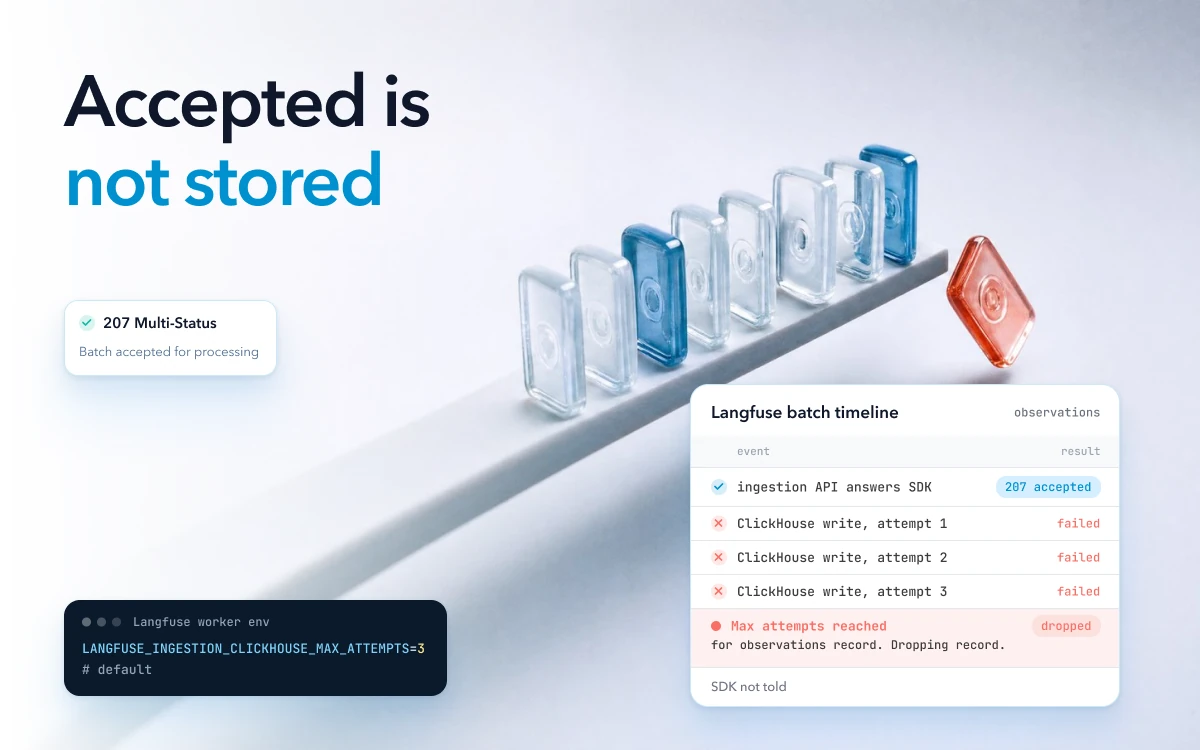
The message means the Langfuse worker tried to write a batch of rows to ClickHouse, failed every time it was allowed to try, and discarded the batch, which can leave one or more traces missing or incomplete. By then the ingestion API had already answered your SDK.
Self-hosted Langfuse splits ingestion across its containers. The web container receives each batch, writes it to S3 and queues a reference in Redis. The worker then picks up the reference, reads the events from S3 and writes them into ClickHouse, the database the UI reads from. Langfuse's FAQ says events are processed asynchronously, so the API does not wait for that last step.
The worker does not write each event on its own. It collects rows in an in-memory writer and flushes them to ClickHouse
in batches. If a flush fails, the rows go back into the writer and are tried again, up to
LANGFUSE_INGESTION_CLICKHOUSE_MAX_ATTEMPTS times, which
defaults to 3 as of October 2026.
After the last attempt, the rows are gone from the worker. The reporter wrote, when the issue was filed: "At that point, only logs
and the langfuse.queue.clickhouse_writer.error metric remain." The same report says this can mean
"permanent loss of traces, observations, scores, and other ClickHouse-backed entities, even though upstream ingestion
or processing jobs appear successful from the application's perspective."
Langfuse kept the design: its maintainer replied that the drop is "correct and expected", and pointed
to a script that replays the events from S3. It did accept the reporter's change, which closed the issue as fixed and
added the langfuse.queue.clickhouse_writer.rows_dropped metric, a count of dropped rows by entity type
meant for alerting.
A second report, on Langfuse v4.3.1, described the same drop as data that is "acknowledged upstream but never lands". Its author added that "nothing signals the SDK or the user that spans went missing." A Langfuse contributor answered that "silently dropping records after retries is not ideal", but that most past drops were ClickHouse timeouts, which the retries handle correctly. The remaining failures, he wrote, are more likely "deterministic malformed or oversized records", which a replay would not help. He closed the issue without adding a dead-letter queue for this path and said he is reworking the ingestion area.
Why Langfuse traces sent while ClickHouse was down are missing after it comes back
Retries can cover a short ClickHouse outage. One that outlasts the attempts leaves gaps. Nothing re-ingests the missing traces when ClickHouse returns.
One team running Langfuse v3 on ECS stopped ClickHouse and found the traces sent during the downtime missing after it came back (issue #6380). Langfuse's maintainer explained that "Short outages should be covered via retries, but longer outages are not supported and may (/will) lead to gaps in the data." On recovery, he added, the traces "won't be ingested automatically once clickhouse recovers." Then: "However, you could manually replay them based on the data stored within S3." He also said: "It's up to you to detect which traces are relevant, though."
The reporter, who had expected the worker to reprocess the traces on its own once ClickHouse recovered, later wrote that "my understanding was incorrect."
The #15730 report reasons that the retry budget is "most likely to be exhausted during a ClickHouse incident or a sustained overload", and Langfuse's reply said that most past drops were ClickHouse timeouts. So most of the drops Langfuse has seen came when the database was in trouble, which is also when you are most likely to go looking for a trace.
Langfuse's maintainer recommended watching the length of the dead-letter queue. A dead-letter queue holds jobs that failed their retries, so they can be inspected and run again. But that queue covers an earlier step than the writer.
In discussion #10565, a team lost the traces sent during a ClickHouse redeploy while their failed-events queue stayed empty. They wrote that "There were no failed events during downtime", which they had confirmed through the admin API and CloudWatch metrics, and that the traces sent during downtime were lost. The only signs were worker log lines, among them "Max attempts reached". A Langfuse team member confirmed that "there is no dead letter queue for this writer queue available."
Who is told when a self-hosted store drops a trace
The sender is not told. In each case in the table, the store had already returned success, and the drop was recorded on the server, if anywhere.
| Store and setup | What drops the trace after success | Where the drop shows |
|---|---|---|
| Langfuse self-hosted, v3 and v4 writer, as of October 2026 | The worker's ClickHouse writer gives up after its attempts (#13468) | A worker log line and the langfuse.queue.clickhouse_writer.rows_dropped metric (#13468) |
| Langfuse, after a Redis disruption | The worker stops consuming its queues while the container stays up (Langfuse docs, #15509) | Nowhere until someone notices, unless the opt-in health check is on |
| Arize Phoenix on PostgreSQL, two or more ingest replicas | An open issue (as of October 2026) reports that two replicas deadlock and one span is rolled back, with no retry (#16113) | A "Failed to insert span" line in the Phoenix server log |
| Grafana Tempo | Per-trace size and live-trace limits are enforced after the distributor accepted the spans (Tempo docs) | The tempo_discarded_spans_total metric. Some drops are logged only at debug level |
The Redis case can go unnoticed for days, because the container and queue-length metrics still look healthy. Langfuse's
opt-in health check on the worker's queue consumption is what catches it. Langfuse's docs say a Redis disruption, such as key eviction, a FLUSHALL or a
failover, "can leave the worker container running while it silently stops consuming all queues".
One team on ECS with ElastiCache Valkey hit it twice and did not notice
"for 2 days and then 3 days". In their words,
"every external signal (container state, queue-length metrics) says the worker is fine while data silently accumulates and is eventually lost."
The trigger was a Redis eviction setting that
Langfuse's docs rule out, plus a manual
FLUSHALL. But the same docs list a failover among the causes.
In Phoenix, when two ingest replicas deadlock on PostgreSQL, the losing span is rolled back, and the project's own contributor wrote that "nothing requeues it, after the SDK was already told 200". An earlier Phoenix report described the same deadlocks: "These kind of deadlocks are appearing frequently in the logs, and we are loosing tracing information." Issue #16113 is open as of October 2026.
Loss does reach your application when the ingestion endpoint itself fails. Langfuse's FAQ says that in that case "you should also see non-207 status codes within your application". A 207 (Multi-Status) is the response the ingestion endpoint returns when it has accepted the batch. One self-hosted Langfuse user saw the SDK log a failed export when requests timed out, and a single Phoenix replica refuses bursts with 503 errors that the exporter sees. Those errors at least show up in your application's logs. The drops in the table happen after your application stopped listening.
How to tell whether a missing trace is lost, late or only hidden
Check, in order, the status codes your application received, the S3 bucket, the worker logs and ClickHouse. That tells you whether the trace is lost, still on its way, or stored and not shown, which all look the same from the trace list.
Start with your own application, because a wrong endpoint or an SDK that exits before it flushes its last batch also leaves gaps. Then follow the order in Langfuse's own check for missing events:
- Look at the status codes your application received and at the web container's logs. If the web container failed, your application will have seen a status other than 207.
- Check the S3 bucket for the event. If it is there, it can be replayed.
- Search the worker logs for errors from the first minute after the event arrived. "Max attempts reached" here means the write to ClickHouse was given up.
- Query ClickHouse for the trace. If the worker says it processed the event and ClickHouse does not have it, Langfuse asks you to open an issue.
A trace that is not there yet may simply be late. Langfuse processes events asynchronously, so a new trace takes a moment to appear. In Tempo, a live-store that lags behind its Kafka partition can make recent traces look incomplete, though by default Tempo fails such a query rather than return partial results.
A trace can also be stored and only partly shown. A Phoenix user at high volume thought spans were being lost, and a Phoenix contributor found the spans in the database. The trace view had been fetching only the first 1,000 spans of the trace, a limit Phoenix has since fixed.
When traces appear and then disappear with "Trace not found"
A trace that shows up in Langfuse and later returns "Trace not found" can point to the ClickHouse cluster rather than to ingestion. One user with a large self-hosted install reported traces that "appear and disappear in the UI", with repeated "Trace not found" errors, and longer HTTP timeouts did not cure it.
The cause in that thread was never confirmed. But Langfuse's maintainer named one setup that often produces this
pattern: the first migrations were
run with CLICKHOUSE_CLUSTER_ENABLED=false before the cluster
grew to several replicas. That leaves the ClickHouse nodes with tables that are not replicated. He added that
"Changing this at a later point is not possible, unfortunately."
So if you run more than one ClickHouse replica, make table replication one of your first checks.
How to get dropped traces back from S3 in Langfuse
To get dropped traces back, replay their events from S3 with Langfuse's script, using S3 server access logs to list them. Langfuse writes every incoming batch to S3 before the worker touches it, and its maintainer points operators to a replay script for events dropped during outages.
The replay is a manual procedure, and it needs one thing set up before the incident. The script's instructions list the events written during the incident window through S3 server access logging on the events bucket. Server access logging is an S3 setting that records the requests made to a bucket, including each event Langfuse writes, but AWS delivers those records on a best-effort basis, so the list can miss an event.
On AWS you query those
logs with Athena for the incident window, export the event keys to a CSV file, and run the script with an admin API
key. The script has a --dry-run flag, so you can check the list before anything is sent.
Turn access logging on now if it is off. The instructions note that the first logs can take some time to appear after you enable it. Without those logs, the documented script has no list of event keys to replay. The documented procedure is written for AWS. On another cloud you need your own way to list the event keys.
The same S3 copy also covers a lost database, as long as you kept the S3 events. One team ran ClickHouse on ephemeral storage, and a restart emptied the UI while the old events stayed in S3. Langfuse's maintainer said ephemeral storage is not a recommended setup, and that "you're also responsible for backups if you go with a self-hosted solution."
How to stop losing traces after ingestion succeeds
Run ClickHouse highly available on persistent storage, set Redis to noeviction, point the liveness probe at the
worker's stuck-queue check, and alert on the signals a drop leaves. You cannot make the SDK hear about a drop that
happens after the response, but these steps make the drops rarer and make sure a person hears about each one.
For self-hosted Langfuse:
- Run ClickHouse so it stays up through restarts. A Langfuse team member wrote, "we strongly recommend to use a highly available ClickHouse instance." Put it on persistent storage and back it up, because a self-hoster is responsible for backups.
- Keep Redis from evicting queue jobs. Langfuse requires
maxmemory-policyset tonoeviction. - Restart a stuck worker automatically. Point your liveness probe at the worker's health endpoint with
?failIfQueueConsumptionStuck=true. The check fails once the worker has processed no jobs for 60 minutes by default (as of October 2026). - Alert on the signals a drop leaves. For the writer, that means the worker log line "Max attempts reached" and
the
langfuse.queue.clickhouse_writer.rows_droppedmetric, which counts dropped rows by entity type. Watch the dead-letter queue length, which Langfuse publishes over StatsD or to CloudWatch, separately: it covers an earlier step, not the writer. - Turn on S3 server access logging on the events bucket, so that a replay has a list to work from.
Raising LANGFUSE_INGESTION_CLICKHOUSE_MAX_ATTEMPTS gives a short blip more chances, but it does not help when
ClickHouse is down for longer. Most drops Langfuse has seen came from ClickHouse timeouts, so most of
the fix is in ClickHouse. A malformed or oversized record fails every attempt, however many you allow.
For Phoenix on PostgreSQL, the deadlock needs two or more ingest replicas. One replica avoids it, but the Phoenix contributor who filed the issue found that a single replica then sheds bursts with 503s, and concluded that "neither configuration is safe under load". Until the issue is fixed, a single replica at least makes the failure visible to your exporter. Watch the server log for "Failed to insert span" either way.
For Tempo, alert on tempo_discarded_spans_total
and size the per-trace and live-trace limits for your largest traces. Tempo's docs say what happens otherwise:
"If limits are too low for your workload, spans are discarded and data is lost."
Does a buffer in front of the store stop the loss?
A buffer protects only what the store has not accepted yet. The usual advice for restarts is an OpenTelemetry Collector with a persistent queue in front of the store, and it does help when the store is unreachable.
The Collector retries for up to 5 minutes by default, and
"Once the queue is full, incoming data is dropped to prevent the Collector from running out of memory." A Collector
that crashes with an in-memory queue loses what it held. A
persistent queue keeps queued data through a crash, but it does not protect against a disk that fails or fills. The Collector counts its own drops in
otelcol_exporter_send_failed_spans and otelcol_exporter_enqueue_failed_spans,
and those are worth an alert too.
But the drops in Langfuse, Phoenix and Tempo all happen after the store said yes, so the Collector has already let go of the batch.
A buffer can also hand the store more than it accepts at once. One Tempo user buffered an hour of spans in Kafka during downtime, and on restart Tempo "consumed all of them almost instantaneously, and dropped most of them" against its live-traces limit. The reply on the issue said the Tempo team never runs Tempo reading straight from a Kafka topic that way, so this is one report in one setup. Still, size or rate-limit the store's intake for the backlog a buffer will replay, not only for normal traffic.
How Oodle takes the write path off your team
With Oodle's hosted service, there is no trace database, queue or worker for your team to run, size, restart or replay from. What runs between the ingestion API and your trace list is the hosted service's to operate, not your team's.
Queries run on serverless compute that spins up per query and shuts down after. With the Langfuse SDK, only the endpoint changes, and OpenTelemetry instrumentation can point at Oodle's hosted service directly.