On This Page
ELK to Oodle AI Migration Guide
Risk-Free Migration. 3x Cost Savings. Zero Ops.
Plus, AI-powered debugging helps teams resolve incidents faster.
For detailed comparisons: Elastic Cloud | Self-Hosted ELK | Shared Responsibilities
"Oodle is five times faster than our Elasticsearch cluster. Our developers naturally moved to Oodle - they didn't need to be told."
Yashwanth Reddy
Senior DevOps Engineer, Olyv
"We'd been juggling CloudWatch and Elastic/OpenSearch - one was reliable but painful, the other easier but flaky. With Oodle, we got the best of both."
Brandon Kite
CTO, Fuel
"Oodle AI debugging has transformed how we debug and make decisions. What used to take hours now takes minutes."
Ramakrishna R
Co-founder and CTO, Cureskin
Reliability
99.9% availability guarantee
< 1 minute ingestion latency for Logs, Metrics and Traces
Security
ISO, SOC2 Type2 & GDPR compliant
RBAC & SSO/SAML integration
Single-tenant deployment option
24x7 Support
Response SLA:
Critical: 15m | High: ~1h | Other: <1d
Private Slack, Intercom & Email
"The best thing about Oodle is the team. They're always there to help out." - Suman, CTO, Fello AI
Trusted by Public companies, Unicorns and high-growth startups


Migration Journey
Run both systems in parallel, verify everything works, then switch.
Ingestion & Setup
⏱️ 2 hours for 1 engineer
✅ Configure dual-ship to Oodle
✅ Import dashboards & alerts
Verification
⏱️ 1-2 weeks (calendar time)
✅ Validate log queries & dashboards
✅ Compare search results side-by-side
Cutover
⏱️ 2 hours for 1 engineer
✅ Activate Oodle alerts
✅ Decommission Elasticsearch
Ingestion & Setup
Effort: 2 hours for 1 engineer
Overview
In this phase, you'll configure your log shippers to send data to both Elasticsearch and Oodle simultaneously. This dual-ship approach ensures zero risk - your existing Elasticsearch setup remains unchanged while you validate Oodle in parallel.
Key benefit: Continue using your existing shippers (Filebeat, Logstash, Vector, OTel, Fluent Bit). No new agents to deploy - just add Oodle as an additional output.
Prerequisites
- Access to update log shipper configurations (Filebeat, Logstash, Vector, etc.)
- Oodle instance URL and API key (from signup)
- If using Grafana for alerting: Grafana URL & Service Account Token
1.a Configure Dual-Ship
Add Oodle as an additional destination for your logs. Choose the shipper you're currently using:
Logstash
If you're using the Filebeat → Logstash pipeline (the most common ELK setup), add an Oodle HTTP output to your Logstash pipeline config. Your Filebeat config stays untouched:
input {
  beats {
    port => 5044
  }
}

output {
  # Keep existing Elasticsearch output
  elasticsearch {
    hosts => ["http://elasticsearch:9200"]
    index => "logs"
  }

  # Add Oodle output
  http {
    url => "https://<OODLE_INSTANCE>-logs.collector.oodle.ai/ingest/v1/logs"
    http_method => "post"
    format => "json_batch"
    content_type => "application/json"
    headers => {
      "X-OODLE-INSTANCE" => "<OODLE_INSTANCE>"
      "X-API-KEY" => "<OODLE_API_KEY>"
    }
  }
}Vector
Add an Oodle sink alongside your existing Elasticsearch sink:
sinks:
  # Keep existing Elasticsearch sink
  elasticsearch:
    type: elasticsearch
    inputs:
      - parse_json
    endpoints:
      - http://elasticsearch:9200
    mode: bulk
    bulk:
      index: logs-%Y.%m.%d

  # Add Oodle sink
  oodle:
    type: http
    inputs:
      - parse_json
    uri: "https://<OODLE_INSTANCE>-logs.collector.oodle.ai/ingest/v1/logs"
    encoding:
      codec: json
    compression: gzip
    request:
      headers:
        X-OODLE-INSTANCE: "<OODLE_INSTANCE>"
        X-API-KEY: "<OODLE_API_KEY>"
      retry_attempts: 3
timeout_secs: 60OpenTelemetry Collector
Add Oodle as an additional exporter in your OTel Collector config. Logs flow to both Elasticsearch and Oodle:
exporters:
  # Keep existing Elasticsearch exporter
  elasticsearch:
    endpoints:
      - http://elasticsearch:9200
    logs_index: logs

  # Add Oodle exporter
  otlphttp/oodle:
    logs_endpoint: "https://<OODLE_INSTANCE>-logs.collector.oodle.ai/ingest/otel/v1/logs"
    headers:
      "X-OODLE-INSTANCE": "<OODLE_INSTANCE>"
      "X-API-KEY": "<OODLE_API_KEY>"

service:
  pipelines:
    logs:
      receivers: [otlp]
      processors: [batch]
exporters: [elasticsearch, otlphttp/oodle]Fluent Bit
Add an Oodle HTTP output alongside your existing Elasticsearch output:
# Keep existing Elasticsearch output
[OUTPUT]
    Name                es
    Match               *
    Host                elasticsearch
    Port                9200
    Index               logs
    Suppress_Type_Name  On

# Add Oodle output
[OUTPUT]
    Name                http
    Match               *
    Host                <OODLE_INSTANCE>-logs.collector.oodle.ai
    Port                443
    URI                 /ingest/v1/logs
    Header              X-OODLE-INSTANCE <OODLE_INSTANCE>
    Header              X-API-KEY <OODLE_API_KEY>
    Format              json
    Compress            gzip
    Json_date_key       timestamp
    Json_date_format    iso8601
TLS On1.b Migration
Migrate your existing dashboards, saved searches, and alerts to Oodle.
Dashboards & Saved Searches
Familiar UI: Oodle uses the OpenSearch UI - the same interface your team already knows from Kibana. Your saved queries, visualizations, and dashboard layouts are easily imported into Oodle.
Oodle provides white-glove migration for all Elasticsearch customers. The Oodle team handles the end-to-end migration of your:
- Kibana dashboards and visualizations
- Saved searches and queries
- Index patterns and field mappings
Lucene query syntax works exactly the same in Oodle - no need to rewrite your queries.
Your team won't need retraining. The OpenSearch UI in Oodle looks and feels just like Kibana - same Discover view, same query bar, same visualization types.

Alerts
What gets imported: Alert rule definitions and thresholds, evaluation intervals, notification policies, severity levels, labels, and annotations.
Most Elasticsearch customers use Grafana for alerting. Oodle migrates all Grafana alerts using the 1-click Grafana import workflow:
- Navigate to Settings → Integrations → Grafana in Oodle
- Enter your Grafana instance URL and Service Account Token
- Run the import - all alert rules, notification policies, and thresholds are migrated
If you are using Prometheus AlertManager:
- Navigate to Settings → Integrations → AlertManager Alerts
- Share
prometheus.yml&alertmanager.ymlfiles - Alternatively, share a Prometheus instance URL & AlertManager URL for Oodle to scrape the alerts
For Kibana Watcher rules or Elastic alerting, the Oodle team provides hands-on migration assistance.
Tip: Configure Oodle alerts to send to a separate Slack channel so you can compare alert behavior side-by-side before switching over.

Verification
Effort: 1-2 weeks calendar time, ~1 day per team
In this phase, teams verify that all logs are flowing correctly, dashboards render as expected, and queries return consistent results. Usually, the DevOps/Platform team verifies ingestion and critical dashboards first, then passes verification to individual application teams.
The bulk of the time is coordination and asynchronous review, not hands-on work.
P.S. For larger companies with dozens of teams, it can be done under a month.
Week 1: DevOps & Platform Teams
- Compare log volume and event counts between Elasticsearch and Oodle
- Spot-check high-priority dashboards and saved searches
- Run sample Lucene queries in both systems and compare results
- Review if alert rules are being evaluated correctly (in test mode)
Week 2: Application Teams
- Each app team reviews their dashboards and saved searches in Oodle
- Verify log queries and field mappings
- Test incident workflows using Oodle's AI debugging
- Check if alerts fire correctly (in parallel with existing alerting)
Turn Off Elasticsearch
Effort: 2 hours for 1 engineer
Once verification is complete and your team is confident, it's time for the final cutover. This is straightforward and reversible if needed.
Prerequisites
- Alert notifications are working as expected
- All critical dashboards and saved searches validated in Oodle
- Ensure sufficient historical data is available by
- Dual-shipping for longer before cutover.
- Request Oodle for a back-fill.
1. Activate Oodle Alerts
Change alert status by updating the notifiers and state
2. Deactivate Existing Alerts
In Grafana/AlertManager or Kibana, silence or disable alert rules to prevent alert storms during transition
3. Switch to Single-Write
Remove the Elasticsearch output from your log shippers - keep only the Oodle destination
4. Decommission Elasticsearch
Shut down your Elasticsearch cluster and cancel your Elastic Cloud subscription. No more ILM policies, shard rebalancing, or JVM tuning - ever again.
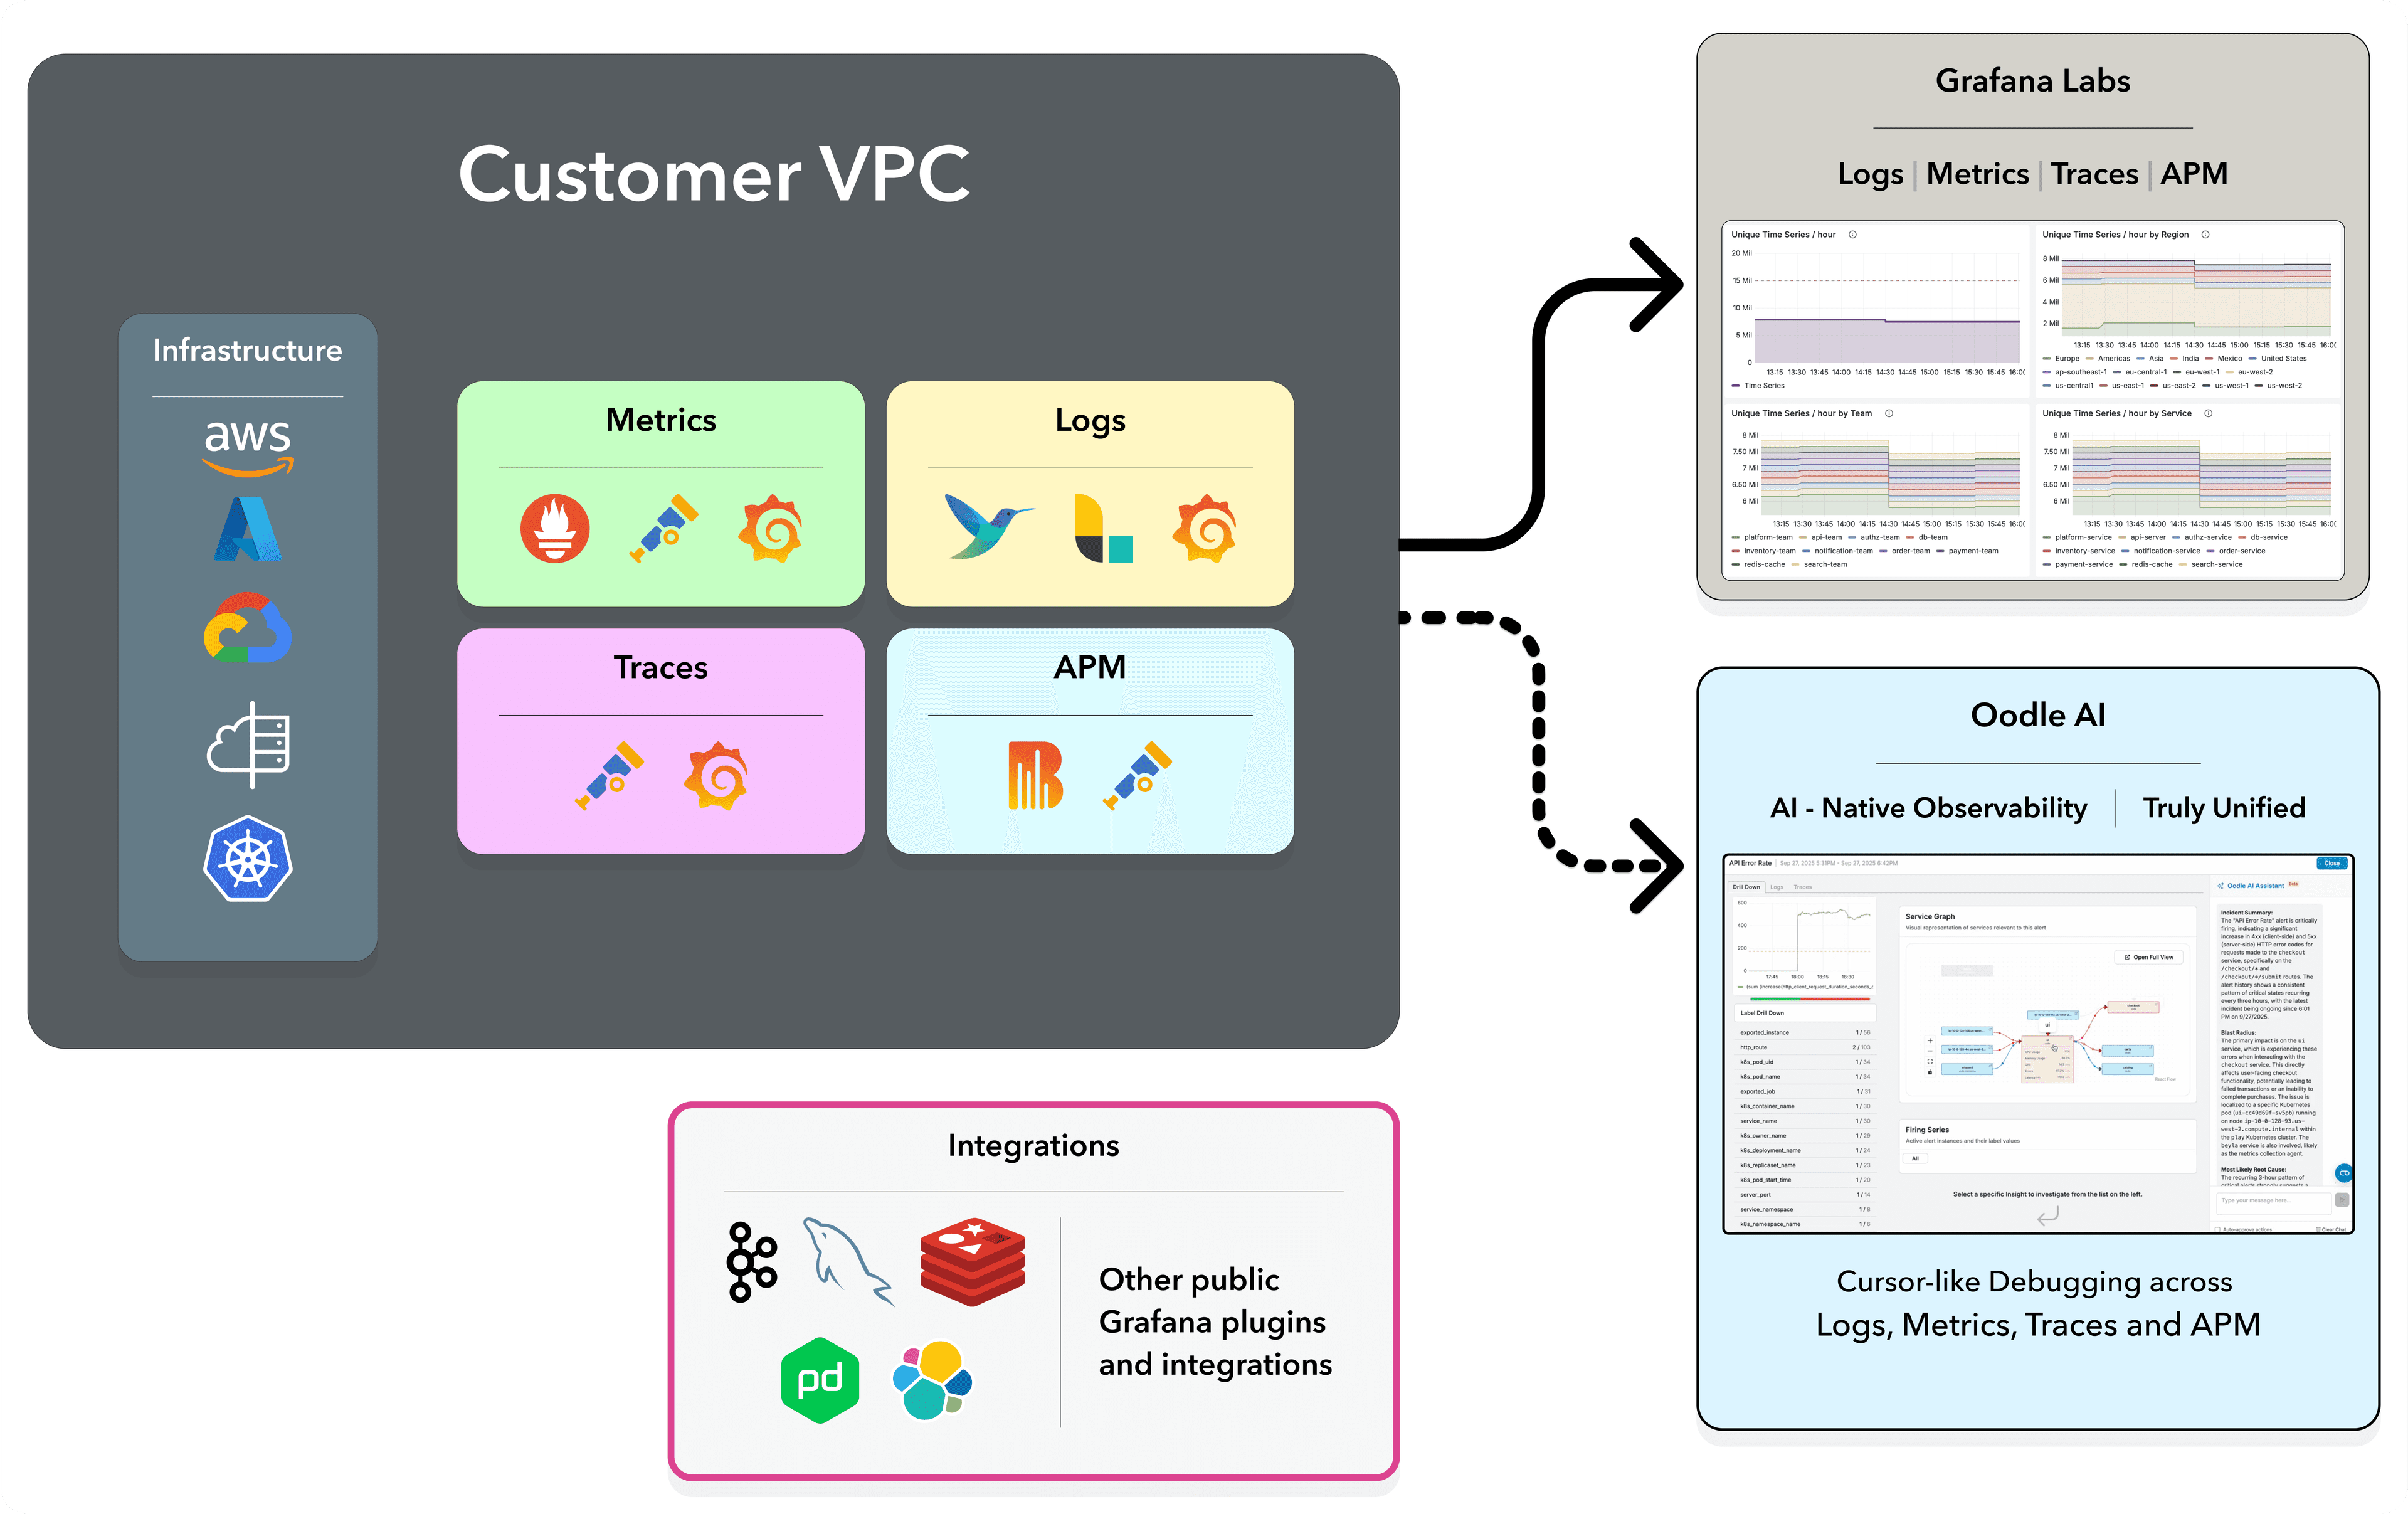
Experience AI-Native Unified Observability
Everything Unified
- Logs, Metrics, Traces, and Service Graph in a single interface
- Familiar OpenSearch UI - no retraining needed
- All your dashboards and alerts, preserved and working
- No more managing separate tools for logs, metrics, and traces
- Automatic correlation across all data types
Agent-driven Debugging
- Ask questions in plain English: "Which services are impacted?"
- AI surfaces relevant logs, traces, and metric anomalies automatically
- Proactive anomaly detection catches issues before alerts fire
- It's like having Cursor for debugging production
Frequently Asked Questions
Common questions about migrating from Elasticsearch to Oodle AI
We're using Elastic Cloud (managed). Why switch?
We use Lucene query syntax heavily. Will it work in Oodle?
We're using Filebeat. Can we keep it?
What about our Kibana dashboards?
How can I migrate out of Oodle?
Ready to Stop Babysitting Elasticsearch?
Your dev/test environment will be sending data to Oodle before our first call wraps up.