What an agent team needs to see in its traces
An agent team needs agent traces that show each conversation in full. That means each model call and each tool call in order, the prompt and the response, tokens and cost, and the whole conversation in one place. For example, when a support agent gives a wrong answer about an order, its trace shows the prompt the model got, the order lookup the agent called and what the lookup returned. An APM built for HTTP requests does not show those well on its own, and that gap is why teams add a separate LLM tracing tool.
A separate tool has a cost. Its traces do not correlate with your logs and APM on their own, so every incident that touches both the agent and the services behind it means matching two systems that were not built to agree.
Why the LLM tool's traces and your logs do not line up on their own
The two systems start from different ids. Langfuse, for example, assigns random 32 hex character trace ids by default, so a trace started with no application span active gets an id of its own. Some agent frameworks start their own trace with their own id format. The OpenAI Agents SDK's tracer uses trace ids in the format trace_<32_alphanumeric>, which is not the trace id your OpenTelemetry tracer writes into your service traces. Unless something bridges them, the same request has two ids in two places.
The LLM tool also receives less of the request than you might expect. An LLM tracing SDK built on OpenTelemetry can see every span in your process, but it may not send them all. By default, the Langfuse SDK exports only LLM-relevant spans: its own spans, spans with gen_ai.* attributes (OpenTelemetry's GenAI conventions), and spans from known LLM libraries. The HTTP call a tool makes and the database query under it stay out unless you change the filter. And the LLM tracing tool does not receive your application logs.
That leaves time as the way to correlate them. OpenTelemetry's logging specification calls correlation by time of execution the most basic form of correlation, and says correlation by time and origin may be fragile when logs and traces arrive through different collection agents.
One team asked an LLM SDK to export to two endpoints, Langfuse for GenAI monitoring and Instana for infrastructure, because the SDK only supports a single OpenTelemetry Protocol (OTLP) endpoint. The maintainers' answer was to run an OpenTelemetry Collector, and the request was closed as not planned.
Alerts split the same way. LLM tracing tools do alert. Langfuse sends alerts over Slack, GitHub Actions or your own webhooks, and LangSmith alerts can route to Slack, PagerDuty, Dynatrace or a webhook. But each tool alerts on its own data, and a LangSmith alert is scoped to one tracing project, or to one environment of one agent. A failure that spans the agent and the services it calls is seen whole by neither tool, so no single alert rule can use both halves.
Do LLM tracing tools cover multi-step agent tool calls?
Yes for the model calls and tool calls the framework wraps, as of October 2026, going by the tools' own docs. No for what the tool does after it is called, unless trace context reaches those services and their spans reach the same tool.
The framework part is well covered. The OpenAI Agents SDK, by default, wraps each LLM generation in generation_span() and each function tool call in function_span(). Langfuse's guidance says framework integrations usually get the nesting right automatically, so each tool call appears under the step that requested it. Steps go missing when you instrument by hand. Langfuse warns against one generation wrapping the whole loop, which shows only aggregated cost and the final output.
But a tool call span ends at the tool's edge. If the tool calls an order service over HTTP and that service queries Postgres, those spans belong to another process. They join the agent's trace only through context propagation: when one service calls another, it passes a trace id and span id, and the receiving service creates its span in the same trace. Tools your own code runs need spans of their own. OpenTelemetry's GenAI conventions ask developers to manually instrument any tool calls that automatic instrumentations do not cover.
The blind spot is downstream work that is not instrumented or propagated, the same place your logs lose the request. The step inside the tool happens in a system the LLM tool never hears from.
Give both tools the same OpenTelemetry trace id
Start by checking whether you already have one id. Take one request, copy its trace id from your APM, and look for it in the LLM tool. If the LLM SDK runs on your application's OpenTelemetry context, its spans carry your trace id already. The Langfuse SDK runs on the shared OpenTelemetry context, so when an application span is active, its observations join that trace.
If the ids differ, the usual cause is a framework tracer that starts its own trace. Then pass your OpenTelemetry trace id into the LLM tool yourself. Langfuse's Python SDK accepts a trace id of 32 hex characters through trace_context. The otel_trace_id line below formats the current OpenTelemetry trace id that way. Run it inside an active span. Outside one, the id is all zeros.
from opentelemetry import trace
from langfuse import get_client

langfuse = get_client()
otel_trace_id = format(trace.get_current_span().get_span_context().trace_id, "032x")

with langfuse.start_as_current_observation(
    as_type="span",
    name="support-agent",
    trace_context={"trace_id": otel_trace_id},  # must be 32 hex characters
):
    run_agent(conversation)
Check the result on one request before you rely on it. The trace id in the LLM tool and the trace id in your APM should now be the same string.
Correlate logs and traces by writing the trace id into every log line
Turn on log correlation, so every log line carries trace_id and span_id and the timestamp search for logs ends, whatever tools you run. OpenTelemetry SDKs can inject the trace id and span id into log records, but in Python it is opt-in. The logging instrumentation turns it on: set the environment variable when the app runs under opentelemetry-instrument, or call LoggingInstrumentor().instrument() in code.
export OTEL_PYTHON_LOG_CORRELATION=true
from opentelemetry.instrumentation.logging import LoggingInstrumentor

LoggingInstrumentor().instrument(set_logging_format=True)
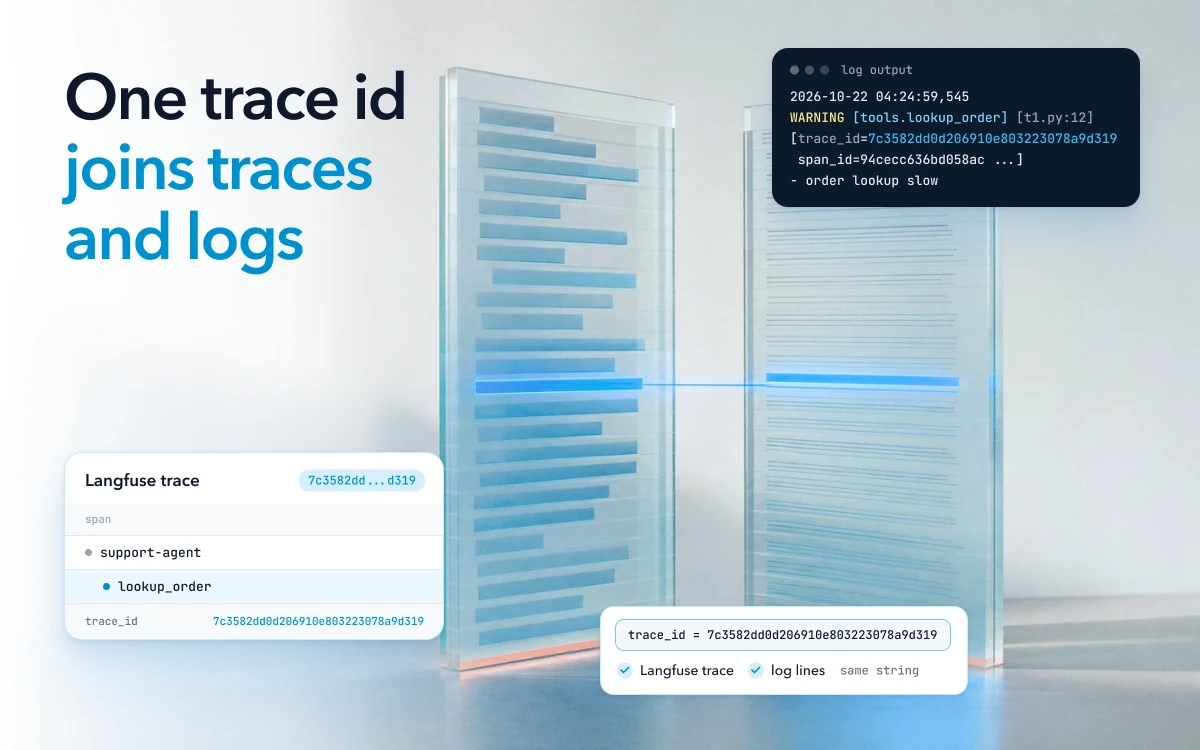
Either way, each line written inside a span then carries the ids. With opentelemetry-sdk 1.45.1, a line looks like this:
2026-10-22 04:24:59,545 WARNING [tools.lookup_order] [t1.py:12] [trace_id=7c3582dd0d206910e803223078a9d319 span_id=94cecc636bd058ac resource.service.name=unknown_service:python trace_sampled=True] - order lookup slow
There is one trap. If your code or a library calls logging.basicConfig before the instrumentation is enabled, its format is not used, so the printed lines show no trace ids. Nothing warns you, and the same line comes out as plain WARNING:tools.lookup_order:order lookup slow.
If you write JSON logs, OpenTelemetry's convention is top-level trace_id and span_id fields. Once every line has them, the logs for a conversation are a search on one field. In the words of the logging specification, the ids let you directly correlate logs and traces that correspond to the same execution context.
Propagate trace context to every service the agent's tools call
The trace id has to travel with each call the agent's tools make, or the services behind them start traces of their own. It travels in the traceparent header. traceparent is the HTTP header from the W3C Trace Context standard, and OpenTelemetry's default propagator uses it. It carries the version, the trace id, the parent span id and the trace flags, as in 00-a0892f3577b34da6a3ce929d0e0e4736-f03067aa0ba902b7-01.
In Python, instrumentation libraries for your HTTP client and web framework propagate context for you, and OpenTelemetry recommends them over doing it by hand. Where a tool uses a transport no library covers, inject the context into the outgoing headers yourself.
from opentelemetry.propagate import inject

headers = {}
inject(headers)  # adds traceparent for the current span
response = client.post(ORDER_SERVICE_URL, json=payload, headers=headers)
Instrument once, and send your spans to an OpenTelemetry Collector that exports to both backends. If the LLM SDK also exports straight to its own backend, keep one of the two paths for it, or its spans are sent twice.
LangSmith's docs recommend exactly this: emit OTEL spans once, then use a Collector to route them to LangSmith and any additional observability backends. The config below sends traces to Langfuse, with the /api/public/otel endpoint and the headers its docs give, and to your APM's OTLP endpoint. It passes otelcol validate on Collector 0.163.2. It shows the routing only: as written, it sends prompt and tool content to both backends.
receivers:
  otlp:
    protocols:
      grpc:
        endpoint: 0.0.0.0:4317
      http:
        endpoint: 0.0.0.0:4318

processors:
  batch:

exporters:
  otlphttp/langfuse:
    endpoint: ${env:LANGFUSE_OTLP_ENDPOINT}  # your region's Langfuse URL ending in /api/public/otel
    headers:
      Authorization: "Basic ${env:LANGFUSE_AUTH_STRING}"
      x-langfuse-ingestion-version: "4"
  otlphttp/apm:
    endpoint: ${env:APM_OTLP_ENDPOINT}
    headers:
      api-key: ${env:APM_API_KEY}

service:
  pipelines:
    traces:
      receivers: [otlp]
      processors: [batch]
      exporters: [otlphttp/langfuse, otlphttp/apm]
This setup breaks quietly in these places.
- The LLM SDK's own filter. If the LLM SDK exports for you, its default keeps LLM-relevant spans only, so the HTTP and database spans never reach that tool. And filtering spans may break the parent-child relationships in your traces.
- A parent sent somewhere else. In LangSmith, a span whose parent is never sent to LangSmith is dropped, and LangSmith will not return an error. This happens when the parent came from a service that exports to a different backend, or was sampled out.
- Prompts going to both places. The OpenAI Agents SDK includes sensitive data in its traces by default. Once one Collector feeds two backends, decide which of them should receive prompt and tool content, and remove it before export for the other.
Where shared trace context breaks in queues
If an agent's work passes through a message queue, propagation has to be done for the message, not only for HTTP calls. OpenTelemetry's messaging conventions say consumer traces cannot be directly correlated with producer traces if the message creation context is not attached and propagated with the message. So the producer has to attach it: a producer SHOULD attach a message creation context to each message. The consumer's spans can then refer back to the producer, as a child span or through span links (references from one span to another outside the parent-child tree), depending on the operation. These conventions are still marked Development, as of October 2026.
No backend can join a trace back together when that context was dropped at the queue. The ids are not in the consumer's spans. Fix it at the producer, and make sure the consumer's instrumentation reads the context from the message.
How to tell your logs and traces are correlated
Take one slow conversation from yesterday and copy its trace id from the agent's trace. That one id should find the API request span, each model call, each tool call, the database query under the tool, and the log lines from every service involved, without lining up timestamps. If any hop needs timestamps to find, that hop is not propagating context or not writing the id into its logs.
Before you add or keep an LLM tracing tool, ask its provider these questions. Does your SDK use my application's OpenTelemetry context, or start its own trace id? Which spans does it export by default? What happens to a span whose parent was not sent to you?
Keeping agent traces and logs on one platform
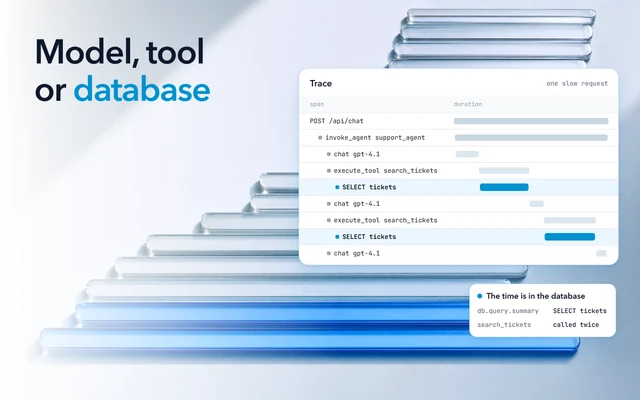
You do not need a second product to find the step that made a reply slow or wrong, or to run evals. Oodle's Agent Observability covers agent traces, AI insights, evals, datasets and prompt management. Its agent traces live on the same platform as logs, metrics, application traces and APM. When each service passes the trace context on, one trace runs from the API request through the agent and its tools to the database query. When a reply is slow or wrong, the step that caused it is in that trace, whether it was the model, the API call or the database.
What goes away is the second product and the matching between two systems. In the trace view, the Logs tab shows logs from the services in the trace, correlated by trace id when available, so your logs still need the trace id written into them. Oodle's skill finds gaps in trace propagation and helps fix them.
If you instrument with OpenTelemetry, you do not re-instrument to try it, because that data reaches Oodle unchanged. If you use the Langfuse SDK, only the endpoint changes, and teams on the LangSmith SDK replace it with OpenTelemetry instrumentation. The one-trace view of an agent request shows what a joined trace looks like.