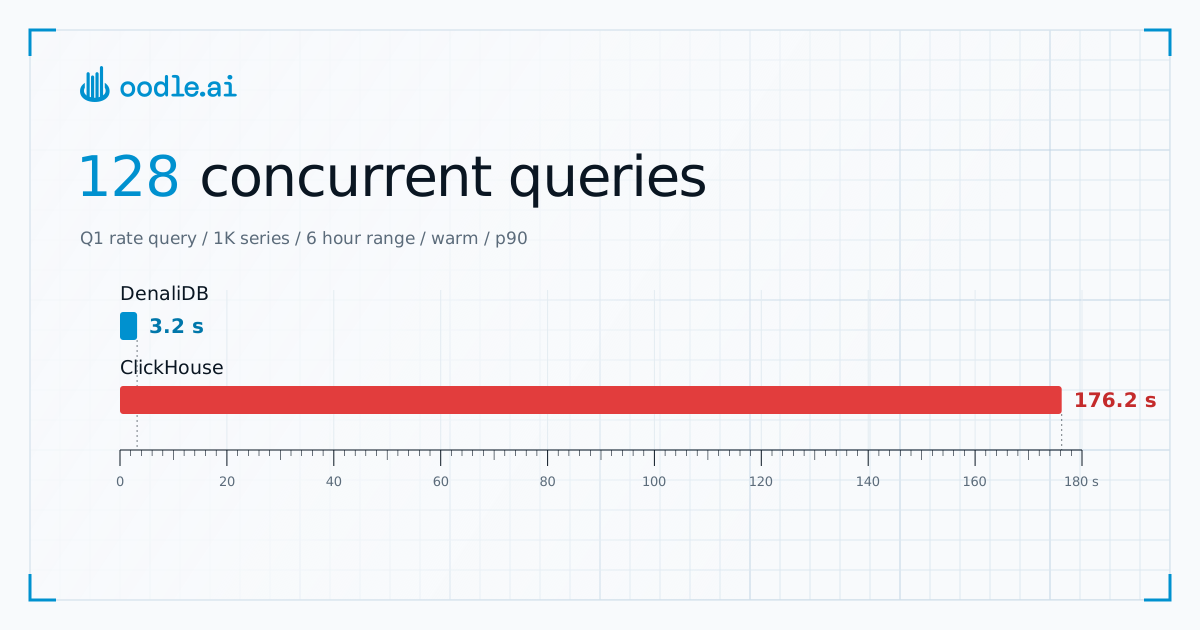

We recently moved our logs product from ClickHouse to DenaliDB, our own serverless logs engine built on DataFusion. While deleting our ClickHouse clusters, I asked Claude to go through every ClickHouse-related production incident from the past two years and group them by cause. This series is built from that list. I hope it helps anyone running serious workloads on ClickHouse, or thinking about using it for their next project.
The first topic is not the one that paged us most, but it definitely gave me the most nightmares: TOO_MANY_PARTS (Code: 252).
Parts and Partitions
ClickHouse MergeTree tables store data in parts. A part is a set of files on disk that never changes once it is written. Small inserts tend to create small parts. ClickHouse merges smaller parts into bigger ones in the background.
A partition is a group of parts that share the same partition key, for example one partition per day of logs. Merges only combine parts inside the same partition, never across partitions. So hourly partitions give you about 24 times as many groups of parts as daily ones, and each group has to be merged on its own.
The number of parts depends on three things: how often you insert, how many partitions each insert touches, and whether merges keep up. Most TOO_MANY_PARTS errors mean merges fell behind. One variation is different: ClickHouse rejects a single insert that writes to too many partitions at once, even when merges are fine.
The variations we hit
We were paged by three different limits that share Code 252, each tied to its own setting. Read the message after Code: 252 carefully, because each one needs a different fix. In one incident our on-call didn't notice it was variation 2, a "poison pill" batch that can never succeed, and followed the runbook for variation 1, which said to add CPU. More CPUs can't fix a poison pill.
Variation 1: one partition has too many parts
Code: 252. DB::Exception: Too many parts .. in table .. Merges are processing significantly slower than inserts.
The table setting parts_to_throw_insert (default 3,000) caps the active parts in one partition. Above it, ClickHouse rejects inserts into that partition. This was our most common case.
A typical example: one customer's logs spiked to about 300,000 events per second. Our logs receiver (the service that batches logs and writes them to ClickHouse) flushed a batch every 10,000 events. That created about 30 new parts per second. Merges fell behind, and the partition hit 3,006 parts.
✅ What worked
- Enabling age-triggered merges on the table. With this setting, ClickHouse merges a group of parts once all of them are at least 300 seconds old. It doesn't add merge capacity and can add merge work, so treat it as a fix for a specific workload, not a blanket fix.
ALTER TABLE logs MODIFY SETTING
    min_age_to_force_merge_seconds = 300;
- More CPUs for merges. We added more CPUs, and later moved our largest customer's queries onto separate compute with compute-compute separation. That setup deserves its own post, so I'll cover it in a separate architecture article.
- Bigger batches. After the spike above, we raised the logs receiver batch from 10,000 events / 10 MiB to 50,000 events / 64 MiB.
- Async inserts, so ClickHouse buffers small inserts on the server and writes fewer, larger parts:
ALTER USER ingest_user SETTINGS
    async_insert = 1,
    wait_for_async_insert = 1,
    async_insert_busy_timeout_ms = 10000,
    async_insert_max_data_size = 524288000;
Variation 2: one insert touches too many partitions
Code: 252. DB::Exception: Too many partitions for single INSERT block (more than 100).
The setting max_partitions_per_insert_block (default 100) caps how many partitions a single insert can touch. A collector in a customer's environment started sending logs that were weeks old into an hourly-partitioned table. One batch spanned more than 100 partitions, so ClickHouse rejected it. Our logs receiver kept retrying it, and everything behind it waited. Ingestion for that customer fell hours behind.
This incident also showed that variations 2 and 3 pull against each other. Smaller batches touch fewer partitions per insert, but create more parts in total. We went back and forth on batch size:
- 10,000 → 1,000 events: variation 2 stopped, but the table hit variation 3 at 10,029 parts.
- 1,000 → 100 events: some data got in, but variation 3 continued and recovery was extremely slow.
- 100 → 1,000 events: variation 3 stopped, and variation 2 came back.
✅ What worked (together)
- After notifying the customer, we configured the logs receiver to drop that customer's logs older than 24 hours. This removed most of the poison pill. We knowingly discarded old logs. This was a targeted emergency measure, not a general late-log policy.
- Turning off the partition check, together with large batches. We set
throw_on_max_partitions_per_insert_block= 0 for the ingestion user, raised the batch size to 50,000 events, and lowered insert concurrency. Each wide insert still writes many parts, but far fewer inserts meant fewer parts overall. After this, the lag started to shrink.
ALTER USER ingest_user SETTINGS throw_on_max_partitions_per_insert_block = 0;
- A bigger disk buffer in the logs receiver, so new logs waited instead of being dropped.
- Moving the table from hourly back to daily partitions. This is the long-term fix, but it can't be done during an incident.
❌ What didn't
- Adding CPU. We added more CPUs and reverted it the next day. The insert is rejected before anything is written, so merges have nothing to catch up on.
- Raising the limit. Our ClickHouse Cloud service didn't let us change
max_partitions_per_insert_blockat the time, so this was not an option. - Changing only the batch size. Each direction traded one variation for the other.
Variation 3: the whole table has too many parts
Code: 252. DB::Exception: Too many parts (10000) in all partitions in total in table ..
The setting max_parts_in_total caps the active parts across the whole table. Above it, every insert into the table is rejected. On our ClickHouse Cloud services it fired just over 10,000 (10,029). The open-source default is 100,000. ClickHouse adds a hint to this message: "This indicates wrong choice of partition key." Both tables that hit it were partitioned by hour.
✅ What worked
- Enabling age-triggered merges with
min_age_to_force_merge_seconds= 300. Each hourly partition was holding several small parts, and merges were not running on them. ClickHouse picks merges that look worth the work, and a partition with only a handful of small parts often doesn't qualify. That is where hourly partitions hurt: a few leftover parts in each of hundreds of hourly partitions is enough to reach 10,000. Within minutes of applying the setting, the errors stopped, and the table went from about 10,000 parts to 4,000. - Moving to daily partitions. This was the permanent fix.
❌ What didn't
- Turning off
throw_on_max_partitions_per_insert_block. We reused the fix from our earlier variation 2 incident, but that setting only affects variation 2. Errors kept coming, and we reverted it the same day. - Bigger batches and lower insert concurrency. New parts got bigger, but the existing ones still weren't merging.
- Async inserts. They helped with variation 1, but batching on the server didn't reduce the parts already in the table.
- More CPUs. It didn't fix it on its own: errors continued after the new nodes came up, until we forced merges. We scaled back down afterwards.
Seven lessons
The fixes above get you out of an incident. These are what I'd do to avoid TOO_MANY_PARTS in the first place.
1. Pick the partition key before onboarding big workloads.
Our default logs schema was partitioned by day, and ClickHouse support had reviewed it. For two very high-volume customers, the logs landing page, which shows the most recent logs, was slow. Hourly partitions and minute order key let that query read less data, so I moved those two customers to hourly partitions. Nothing broke on the day of the switch. Over the following months, though, those two tables caused all three variations. Moving them back to daily meant a new table, a view over the old and new tables, a backfill, and a rollback plan for each customer. With daily partitions, the landing page got slower again. We accepted a slower experience than we wanted, and made up some of it by adding more CPUs and raising max_threads (how many CPU threads one query can use) for that query.
2. Batch large, and tune per customer.
The ClickHouse docs recommend 10,000 to 100,000 rows per insert. For our high-volume tables, 100,000 rows was a good starting point. Limit batches by bytes as well as rows, and tune for your row size, memory, and acceptable delay. Server-side async inserts also helped. With async_insert_max_data_size at 100 MiB our logs receiver buffers backed up. At 500 MiB they stayed flat. That was our workload's result, not a universal sizing recommendation.
3. Count your materialized views.
A materialized view runs on every insert and writes its results to another table. So each view can add its own parts and merge work. How much depends on what the view writes and how its target table is partitioned, not just on the number of views.
4. Put a durable queue in front of ClickHouse.
ClickHouse will slow down or reject inserts, so something has to hold that data. Disk-backed buffers in our logs receiver are why our worst merge backlogs lost no logs. You also need a way to set aside a batch that will never succeed.
5. Keep merges and queries apart.
They compete for the same CPUs, and several of our merge backlogs happened at the same time as expensive queries. In the end we moved our largest customer's queries to their own compute with compute-compute separation. More on that in a future post.
6. Alert before inserts fail.
At first we found out from our logs receiver's buffer filling up. Rejected inserts are the one alert you must have, because they mean data is not being written. The other signals fire earlier, while there is still time to act. These are the metrics I'd alert on, most important first:
- Page: rejected inserts above 50 per minute (warn above 10). ClickHouse is refusing data. Our logs receiver retries, so a few rejections during a short burst clear up on their own. A steady rate means it isn't catching up.
- Warn, then page: parts in the worst partition (MaxPartCountForPartition). Warn at 1,000 (parts_to_delay_insert, where ClickHouse starts slowing inserts down) and page at about 2,500, well before 3,000 (parts_to_throw_insert). Adjust to your own table settings. This is the early warning for variation 1.
- Warn, then page: logs receiver health. Warn when its disk buffer passes 30% full, and page on dropped events.
- Warn: total parts per table at about 8,000, for a 10,000 max_parts_in_total limit. This is the early warning for variation 3.
- Warn: delayed inserts above 0. ClickHouse starts delaying inserts once a partition passes parts_to_delay_insert (1,000 parts). Nothing has failed yet, but it's the earliest sign that merges are falling behind.
- Warn: server CPU above 80% for several minutes.
7. Give each variation its own runbook.
All three errors start with Code: 252, but the fixes barely overlap. More CPUs helped with variation 1 but didn't fix variations 2 or 3. Age-triggered merges fixed variations 1 and 3 but don't help with variation 2, where the insert is rejected before anything is written. Make the first runbook step "read the message after Code: 252", and branch from there.
A few quick queries if you are paged
Which variation are you hitting?
SELECT
    toStartOfMinute(event_time) AS minute,
    substring(exception, 1, 60) AS error,
    count() AS errors
FROM
    clusterAllReplicas('default', 'system.query_log')
WHERE
    query_kind = 'Insert'
    AND type IN (
        'ExceptionBeforeStart',
        'ExceptionWhileProcessing'
    )
    AND exception_code = 252
    AND event_time > now() - INTERVAL 1 DAY
GROUP BY
    minute,
    error
ORDER BY
    minute DESC;
Which partitions are closest to the limit?
SELECT
    database,
    table,
    partition,
    count() AS parts
FROM
    clusterAllReplicas('default', 'system.parts')
WHERE
    active
GROUP BY
    database,
    table,
    partition
ORDER BY
    parts DESC
LIMIT 10;
Which tables are closest to the total limit?
SELECT
    database,
    table,
    count() AS parts
FROm
    clusterAllReplicas('default', 'system.parts')
WHERE
    active
GROUP BY
    database,
    table
ORDER BY
    parts DESC
LIMIT 10;
Are inserts too small or too frequent?
SELECT
    toStartOfMinute(event_time) AS minute,
    count() AS inserts,
    round(avg(written_rows)) AS avg_rows_per_insert
FROM
    clusterAllReplicas('default', 'system.query_log')
WHERE
    query_kind = 'Insert'
    AND type = 'QueryFinish'
    AND event_time > now() - INTERVAL 1 HOUR
GROUP BY
    minute
ORDER BY
    minute DESC;
Which merges are running right now?
SELECT database, table,
       round(elapsed) AS seconds,
       round(progress * 100) AS pct_done,
       num_parts
FROM clusterAllReplicas('default', 'system.merges')
ORDER BY elapsed DESC
LIMIT 10;
What's next?
The list has plenty more: TTL updates that kept CPU busy, merges failing on memory limits, and materialized views that silently drop rows. Which one should I write about next? Tell me in the comments.