TL;DR
Not yet. ClickHouse slows down as series, time range and concurrency grow. These factors become even more important with agents becoming the primary consumer of observability data.
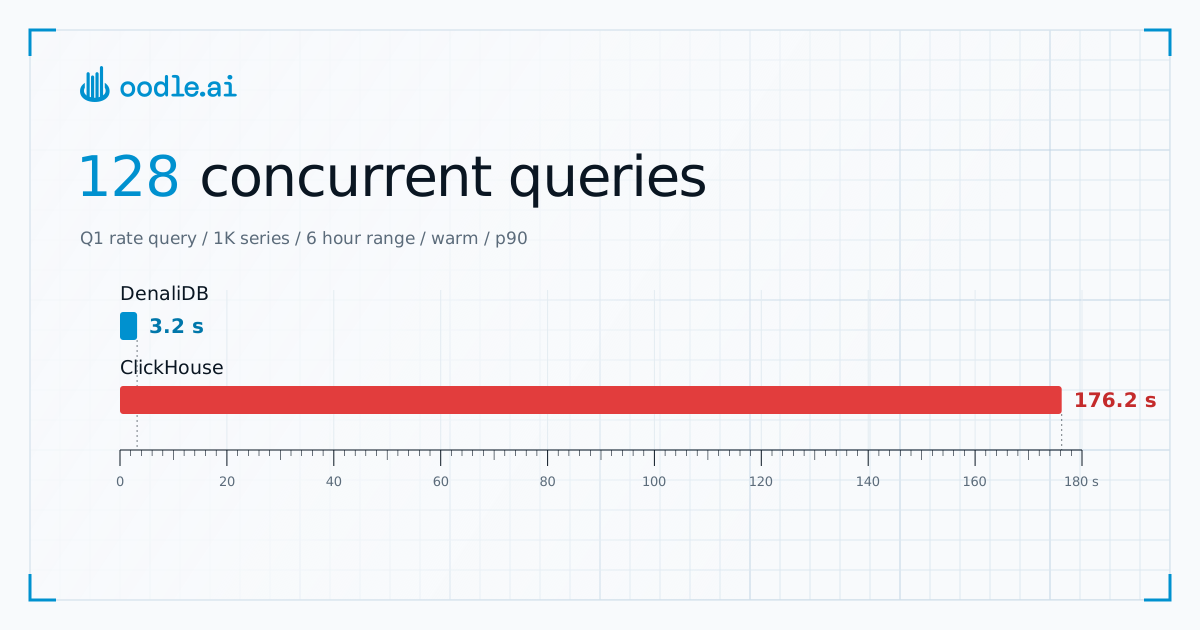
25M active series. ClickHouse on one 192 vCPU node with NVMe vs DenaliDB.
| ClickHouse | DenaliDB | |
|---|---|---|
| 1K series, 128 concurrent queries (p90) | ||
| 250K series, 6 hours | ||
| 250K series, 24 hours | ||
| Bytes per sample on disk, with HA |
Why this benchmark?
ClickHouse is an amazing real-time analytics database.
Oodle started as a metrics platform. There were great metrics databases already - Prometheus, M3DB and others - but none handled the scale we wanted at the price we wanted. So in 2024 we built our own metrics engine, DenaliDB. We evaluated ClickHouse for metrics back then too, but it was not suited to the shape of metrics data, which is very different from analytics and logs. Metrics arrive sideways: each scrape sends one sample for every series, but a query wants all the samples of a few series.
In 2025 we launched our logs product. We had to launch quickly, and ClickHouse was already well known for logs and events, so we launched on it. It worked great for our initial customers, but as we started onboarding larger customers, we ran into challenges and had to extend DenaliDB to support logs.
Tao talks about our learnings operating ClickHouse at scale in detail in his blog series:
What I wish I (and my agents) had known about ClickHouse







ClickHouse recently launched ClickHouse Observability. One thing that caught my eye is this quote from the post about metrics on ClickHouse:
ClickHouse doesn't suffer with cardinality, so neither should you.
ClickHouse makes the same case for high cardinality in ClickHouse vs Prometheus for High Cardinality.
This made me rethink: would our metrics engine benefit if I changed its data layer to ClickHouse?
The question also looks different today than it did in 2024. Agents are now the main consumers of observability data: as of writing this, more than 93% of the metric queries at Oodle come from agents. And agents run parallel investigations when they debug - so performance under concurrent load is an important factor to test.
So I started on this benchmarking journey.
Benchmark setup
The setup, load and query scripts are in clickstack-vs-oodle-benchmark.
| Workload | Into each system |
|---|---|
| Active series | 25M |
| Metrics | 100 counters, 250K series each |
| Samples ingested | 1.67 M / sec |
| Data ingested | 1.62 GB / sec (uncompressed OTLP) |
| Labels per series | 24 |
| Scrape interval | 15 sec |
Load: 250 avalanche pods scraped by OpenTelemetry Collectors. Each pod had 100K series.
ClickHouse: ClickStack, ClickHouse's observability stack, from its official Helm chart 3.5.0 (HyperDX 2.44, ClickHouse 26.8). I tuned it per ClickHouse's docs to handle this ingest, and left the schema as it is.
Changes from ClickStack's defaults
At the defaults, ClickHouse refused inserts at 1.67M samples / sec. I changed only these, following ClickHouse's docs.
| Setting | Default | Benchmark |
|---|---|---|
| CPU, memory | 0.5 cores, 2 GiB | 184 cores, 1.4 TiB (1,260 GiB for queries) |
| Disk | 10 GiB | 11.4 TB local NVMe (6 x 1,900 GB, RAID 0) |
background_ | 16 | 64 |
| Collectors | 1 | 14 (4 CPU, 8 GiB each) |
Collector memory_ | 1.5 GiB | 6.4 GiB |
HYPERDX_ | 10K rows | 100K rows |
HYPERDX_ | 5 sec | 30 sec |
max_ | 100 | 500 |
concurrent_ | 2 | 4 (up to 30% speedup) |
max_ | 10 GB | 1.2 TB |
max_ | 60 sec | 900 sec |
Query: I benchmarked a common query - request rate per service, over 1 to 250K series - and two others at 100K and 250K series. A series is one metric with one set of label values, such as http_requests_total{service="checkout", pod="checkout-7f9c"}, and it gets a new sample every 15 seconds.
# Q1: API rate by service
sum by (service) (
  rate(avalanche_counter_metric_mmmmm_0_0_total{<selector>}[5m])
)

# Q2: Top 10 pods by request rate
topk(10,
  sum by (pod) (
    rate(avalanche_counter_metric_mmmmm_0_0_total{<selector>}[5m])
  )
)

# Q3: Error ratio by service
sum by (service) (
  rate(avalanche_counter_metric_mmmmm_0_0_total{<selector>, label_key_kkkkk_6="0"}[5m])
)
/
sum by (service) (
  rate(avalanche_counter_metric_mmmmm_0_0_total{<selector>}[5m])
)
Most results below use Q1. Q2 and Q3 are under Other queries.
Cold Query: before every ClickHouse run I dropped its caches and the OS page cache, close to how ClickBench measures cold.
Warm Query: the same query ran once first, untimed. Result caches were off on both sides. Median of 5 runs. ClickHouse does not read from disk in warm runs - it is all from page cache.
No Result Cache: Result cache is cleared before each run. Both ClickHouse and DenaliDB serve from result cache in < 5ms.
Verification: I verified that both ClickHouse and DenaliDB return the same data.
Scale: Given the 15 sec sampling interval, and 250K touched, a 6 hour interval would touch 6 * 60 * 4 * 250000 = ~360M samples.
Hardware
The next question was what kind of hardware to give ClickHouse to make this benchmark comparable. The better the hardware, the better ClickHouse would perform - but also increases your costs.
Since I wanted to benchmark with 25M metrics, I decided to start with list price of Oodle for 25M metrics. This comes to $19,500/month. I chose ClickHouse hardware that costs about the same.
Yes, that compares ClickHouse's raw hardware cost with Oodle's list price, which includes our margins. That tilts the comparison in ClickHouse's favor: take out a healthy SaaS margin and you get our actual infrastructure cost. What I went with was:
| ClickHouse, single node | Per month |
|---|---|
| r8gd.48xlarge (192 vCPU, 1.5 TiB, 11.4 TB local NVMe, 50 Gbps network, 7 day retention) | $10,299 |
| Collectors, HyperDX, MongoDB (3 x c7g.8xlarge) | $2,540 |
| Total | $12,840 |
| With HA | $25,680 |
| With HA, 90 day retention | $47,600 |
I used AWS on-demand rates for ClickHouse hardware costs. Oodle price includes HA and a 90d retention, and HA will be needed for any production observability setup. The local NVMe holds about 7 days. For 90 days I added the older data on gp3 at $0.08/GB-month, at 3.3 TB/day across both replicas (see Storage). Queries over that data would be slower than NVMe. S3 would cost less but be even slower.
| Per month, 25M series | ClickHouse (hardware only) | Oodle (list price) |
|---|---|---|
| With HA, 7 day retention | ||
| With HA, 90 day retention |
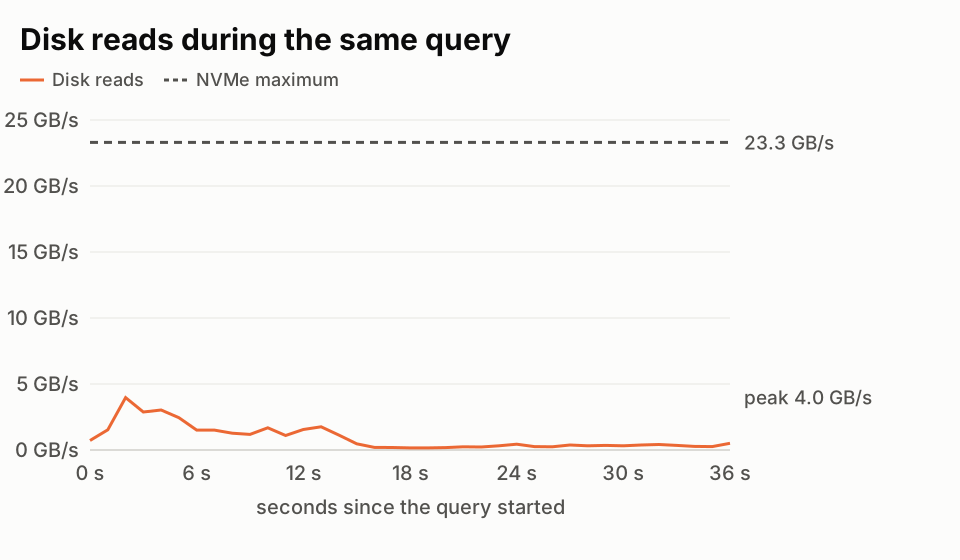
I initially started with gp3 for benchmarking, but realized disk throughput was limiting ClickHouse performance. So I switched to local NVMe disks. ClickHouse cold was 2-8x slower than ClickHouse warm with gp3. With NVMe, cold adds 0.3 to 1.4 s to small queries and under 5% from 100K series up, since disk was no longer a bottleneck.
| Disk | gp3 | NVMe |
|---|---|---|
| Sequential read | 1.05 GB/s | 23.3 GB/s |
| Sequential write | 1.05 GB/s* | 11.0 GB/s |
| Random 4K read | 10K IOPS | 3.25M IOPS |
* gp3's 1.05 GB/s is shared between reads and writes.
Would a sharded ClickHouse Cluster help?
No. ClickStack computes rate() with a SQL window function, and in a distributed query ClickHouse runs window functions only on the node that received the query. The other shards just read and filter their rows and send them all to that node. So in this case a single large node is better than splitting it into shards - assuming the same total capacity.
Would separating storage and compute help ClickHouse?
Yes, but harder to do for ClickHouse with disk backed data. It can be done with S3 backed storage, but performance would be worse. But the total hardware spec I chose was for Ingestion + Queries, to keep resources comparable with Oodle list price.
ClickHouse Cloud has separation of storage and compute with comparable performance, but also costs more :)
Would materialized views help?
Yes! But has to be manually maintained for each kind of query you want to perform, and adds extra cost at ingestion. I did not test with materialized views, and used the default ClickStack schema. I am planning to run with materialized views in my next benchmark.
Results
Concurrent workloads
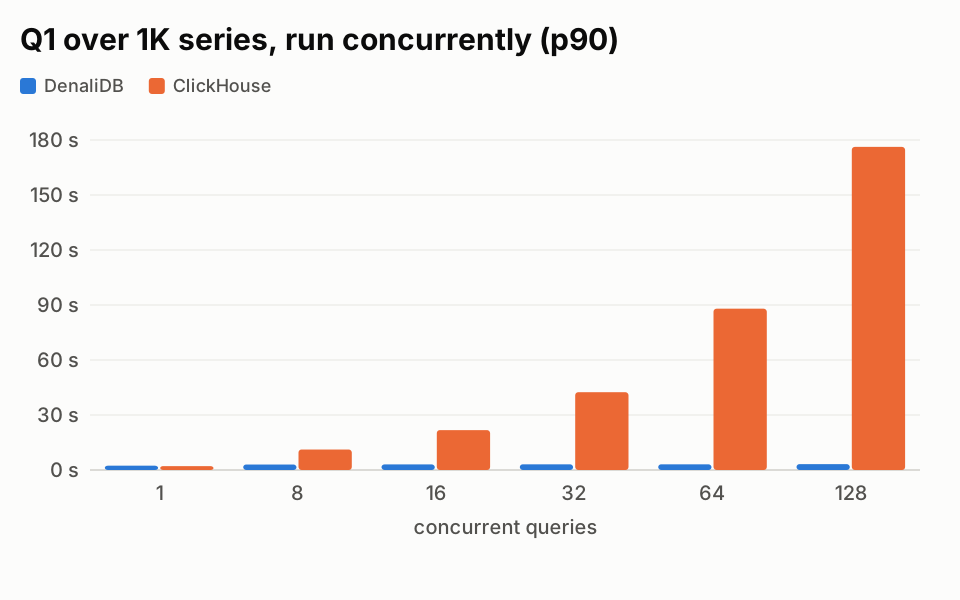
ClickHouse performance degrades with concurrent workloads because all queries compete for the fixed available compute. With 128 concurrent queries, ClickHouse ingestion also fell behind (100M to 66M rows per minute) and the collectors backed up.
Concurrent query performance is actually even more important in today's world where agents are the primary consumers of observability data.
All concurrency results (warm)
Q1 over 6 hours, 5 rounds per level. No query failed on either side.
| Series | At once | DenaliDB | ClickHouse | ||
|---|---|---|---|---|---|
| Median | p90 | Median | p90 | ||
| 1K | 1 | ||||
| 1K | 8 | ||||
| 1K | 16 | ||||
| 1K | 32 | ||||
| 1K | 64 | ||||
| 1K | 128 | ||||
| 25K | 1 | ||||
| 25K | 2 | ||||
| 25K | 4 | ||||
| 100K | 1 | ||||
| 100K | 2 | ||||
| 100K | 4 | ||||
| 250K | 1 | ||||
| 250K | 2 | ||||
| 250K | 4 | ||||
More series per query
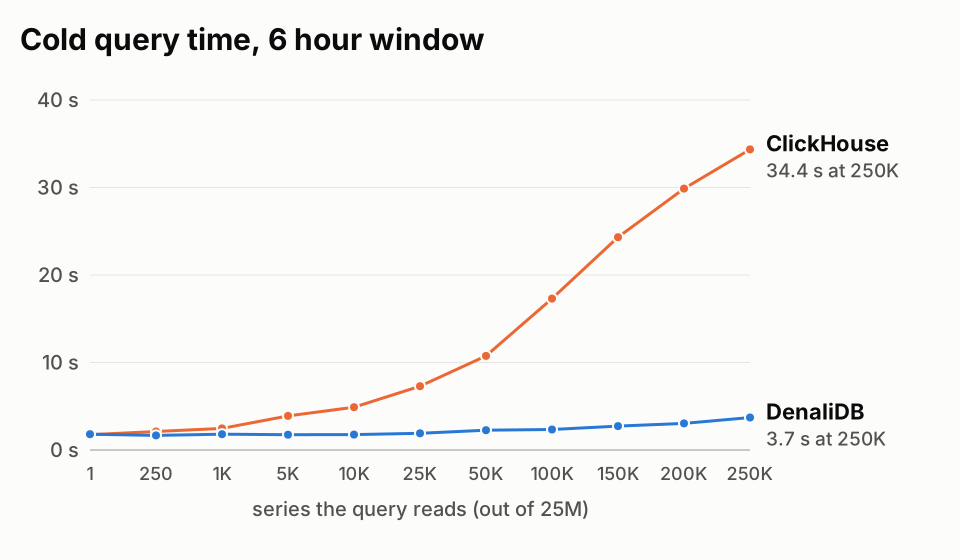
ClickHouse gets significantly slower as the number of series touched increases. ClickHouse cold and warm are pretty close now, but cold was much slower than warm when I was running the benchmark with gp3 instead of NVMe disks.
ClickHouse details (cold)
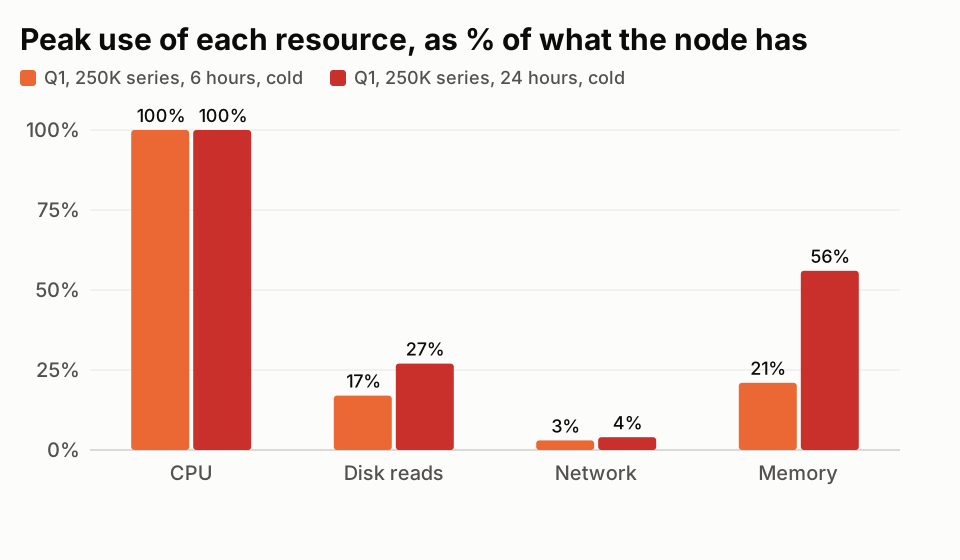
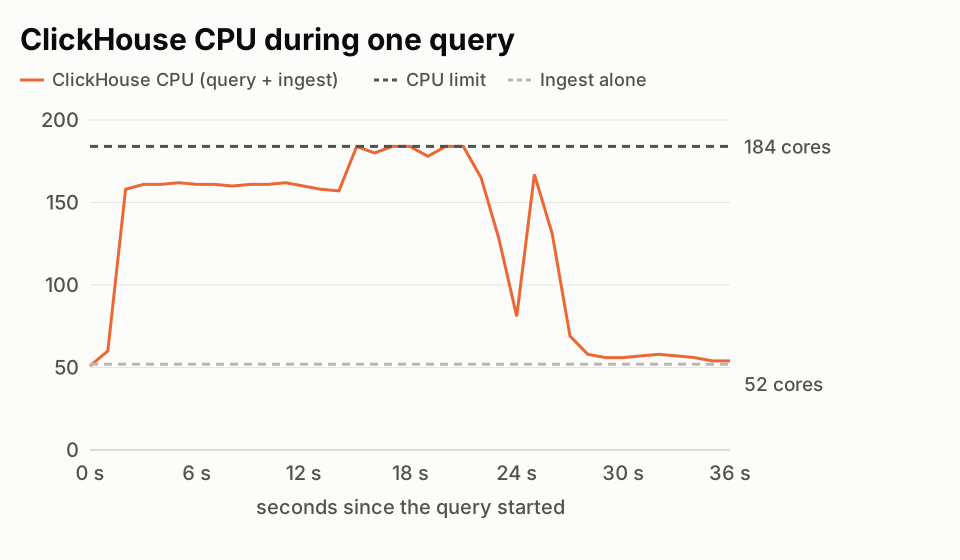
What ClickHouse reported in its own query log. Medians of 5 runs. In the Limit column, CPU means ClickHouse reached all 184 of its cores during the query (query plus ingest), not that it was CPU-bound throughout.
| Series | Rows | CPU-s | Memory | Time | Limit | |
|---|---|---|---|---|---|---|
| Returned | Read | |||||
| 1 | 73 | 205M | 76 | <1 GiB | - | |
| 250 | 73 | 211M | 133 | 2 GiB | - | |
| 1K | 73 | 210M | 202 | 3 GiB | - | |
| 5K | 73 | 358M | 369 | 11 GiB | - | |
| 10K | 73 | 374M | 448 | 19 GiB | - | |
| 25K | 73 | 379M | 621 | 39 GiB | - | |
| 50K | 146 | 380M | 943 | 72 GiB | - | |
| 100K | 292 | 380M | 1,481 | 124 GiB | - | |
| 150K | 438 | 375M | 2,040 | 173 GiB | - | |
| 200K | 584 | 375M | 2,516 | 217 GiB | CPU | |
| 250K | 730 | 377M | 2,846 | 259 GiB | CPU | |
ClickHouse details (warm)
The same query run once first, untimed, so the data was already in memory and nothing came off the disk. Medians of 5 runs. In the Limit column, CPU means ClickHouse reached all 184 of its cores during the query (query plus ingest), not that it was CPU-bound throughout.
| Series | Rows | CPU-s | Memory | Time | Limit | |
|---|---|---|---|---|---|---|
| Returned | Read | |||||
| 1 | 73 | 205M | 70 | <1 GiB | - | |
| 250 | 73 | 210M | 124 | 2 GiB | - | |
| 1K | 73 | 210M | 186 | 3 GiB | - | |
| 5K | 73 | 358M | 363 | 10 GiB | - | |
| 10K | 73 | 374M | 445 | 19 GiB | - | |
| 25K | 73 | 379M | 613 | 40 GiB | - | |
| 50K | 146 | 380M | 945 | 72 GiB | - | |
| 100K | 292 | 380M | 1,478 | 124 GiB | - | |
| 150K | 438 | 375M | 2,010 | 173 GiB | - | |
| 200K | 584 | 375M | 2,455 | 216 GiB | CPU | |
| 250K | 730 | 377M | 2,778 | 258 GiB | CPU | |
What limits ClickHouse?
When I was trying gp3 disks, disk was also a limit, but after NVMe disks, compute was the only bottleneck.
Other queries
Q2 and Q3 over 6 hours, medians of 5 runs.
| Query | Series | DenaliDB | ClickHouse | |
|---|---|---|---|---|
| Cold | Cold | Warm | ||
| Q2: top 10 pods | 100K | |||
| Q2: top 10 pods | 250K | |||
| Q3: error ratio | 250K | |||
Longer time ranges
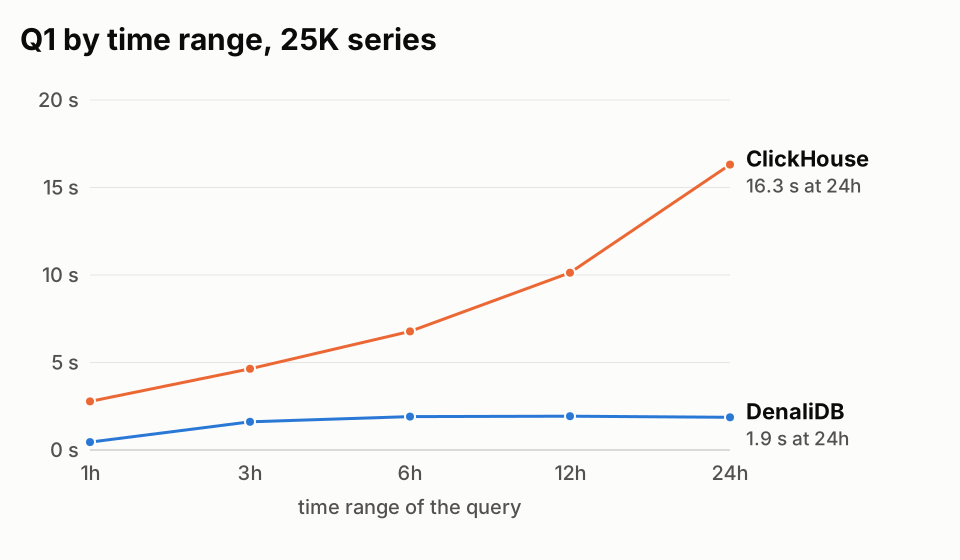
Apart from number of series being touched by a query, it's also important to benchmark how time range of a query impacts performance.
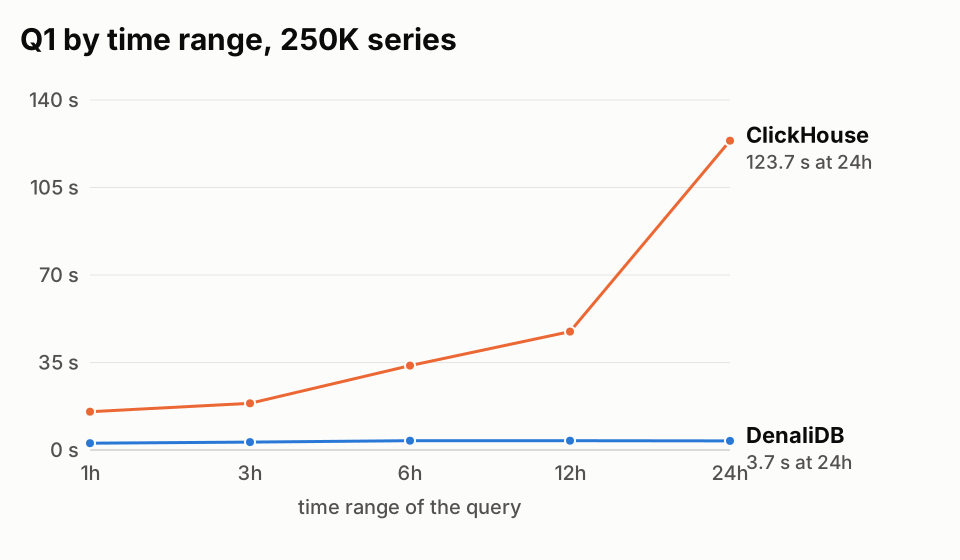
All time ranges (warm)
Q1 at each time range, with the step the ClickStack UI picks for it: 1 minute for 1 hour, 5 minutes for 3 and 6 hours, 10 minutes for 12 hours and 30 minutes for 24 hours. PromQL used the same steps. Answers matched on every query. DenaliDB is flat from 3 to 24 hours; differences under 0.2 s are run-to-run noise. In the Limit column, CPU means ClickHouse reached all 184 of its cores during the query (query plus ingest), not that it was CPU-bound throughout. Warm runs read nothing from disk.
| Series | Range | Time | ClickHouse | |||
|---|---|---|---|---|---|---|
| DenaliDB | ClickHouse | Rows read | Memory | Limit | ||
| 1 | 1h | 59M | <1 GiB | - | ||
| 1 | 3h | 132M | <1 GiB | - | ||
| 1 | 6h | 205M | <1 GiB | - | ||
| 1 | 12h | 294M | <1 GiB | - | ||
| 1 | 24h | 433M | <1 GiB | - | ||
| 1K | 1h | 59M | 1 GiB | - | ||
| 1K | 3h | 125M | 2 GiB | - | ||
| 1K | 6h | 210M | 3 GiB | - | ||
| 1K | 12h | 298M | 4 GiB | - | ||
| 1K | 24h | 435M | 6 GiB | - | ||
| 25K | 1h | 63M | 10 GiB | - | ||
| 25K | 3h | 205M | 27 GiB | - | ||
| 25K | 6h | 379M | 40 GiB | - | ||
| 25K | 12h | 746M | 66 GiB | CPU | ||
| 25K | 24h | 1.45B | 101 GiB | CPU | ||
| 100K | 1h | 64M | 29 GiB | - | ||
| 100K | 3h | 205M | 74 GiB | - | ||
| 100K | 6h | 380M | 124 GiB | - | ||
| 100K | 12h | 764M | 200 GiB | CPU | ||
| 100K | 24h | 1.50B | 327 GiB | CPU | ||
| 250K | 1h | 63M | 69 GiB | - | ||
| 250K | 3h | 192M | 134 GiB | - | ||
| 250K | 6h | 377M | 258 GiB | CPU | ||
| 250K | 12h | 766M | 437 GiB | CPU | ||
| 250K | 24h | 1.52B | 703 GiB | CPU | ||
Cold over 24 hours, the 250K-series query took 123 seconds on ClickHouse and peaked at 703 GiB of memory. ClickHouse was allowed 1,260 GiB, so two of them at once don't fit.
Storage
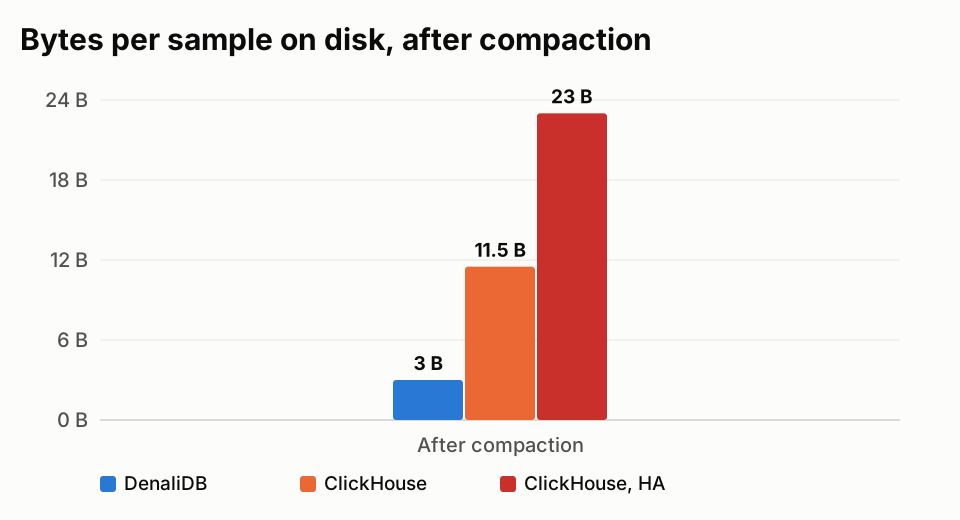
For this benchmark, ClickHouse (with HA - 2 replicas) would store 3.3 TB/day and DenaliDB would store 0.43 TB/day.
What about the new ClickHouse TimeSeries engine?
In September ClickHouse announced a TimeSeries table engine with PromQL support. It's still in private preview, and I could not complete a benchmark of it. My notes so far are in ClickHouse TimeSeries engine for metrics.
Why does DenaliDB not degrade at scale?
DenaliDB stores all data in S3, and uses lambda functions for queries. This helps each query run independently of other queries, and allows massive parallel execution of heavy queries.
There is a catch for us though. Lambda functions, if constantly run, will increase our own infrastructure costs at Oodle. But how we solve that is by our result cache. In our production, 73% of all human + agent metric queries are served from the result cache. More details about our architecture is in how Oodle keeps observability fast at scale.
I believe with agents becoming the primary consumer of observability data, having this property is extremely important.
Has ClickHouse conquered metrics?
Not yet. In my benchmark, ClickHouse did not scale well with queries that run concurrently or read more data. ClickHouse was built for analytics and logs first. The new TimeSeries engine made for metrics is still in private preview and has some issues.
This is not the fastest ClickHouse can be. I ran ClickStack's default schema. Materialized views would likely be faster, but each view has to be built and kept up for the queries you expect, and adds work at ingest. It's not just dashboards any more and it is hard to predict what dimensions agents will query to build the materialized views. I plan to test with materialized views in my next benchmark.
So we are not changing our metrics engine to ClickHouse at this time. As ClickHouse improves its metrics engine, I will continue benchmarking against it and see where things go!
As a thought exercise, ask Claude or ChatGPT how much this benchmark - 25M series at 15s scrape would cost on ClickHouse Observability :)
Running metrics at this scale?
Point your Prometheus or OpenTelemetry collector at Oodle and compare on your own data.