
TL;DR
- You start in a single cloud, quickly expand to multiple regions, and then to multiple clouds.
- Monitoring grows the same way, with each cloud's own tools or a self-hosted stack per region, sometimes tied together with a global Grafana or Thanos.
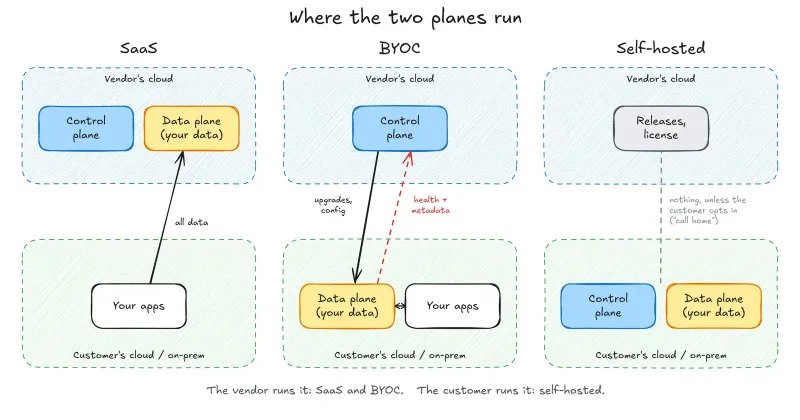
- A unified view means sending data out of each region and cloud, which isn't always allowed. Most teams keep telemetry where it's produced, and the unified view is never quite unified.
- During an incident, the on-call engineer spends the first 15 minutes working out which console to open, in one of half a dozen query languages.
- AI agents can query every CLI and MCP server, but they spend tokens working out where to look, and cloud CLIs give them far more access than observability needs.
- Datadog or another managed vendor would put everything in one place, but at tens of regions across three clouds most of them cost more than finance will approve.
How you end up on three clouds
You start on one cloud because your customers are there, because it gave you the most credits, or because your CTO knows it best. Then a European customer wants its data kept in Europe, a big customer will only sign if you run in its cloud, and a few years in you're in tens of regions across AWS, GCP and Azure.
You have plenty of company. Flexera's 2026 State of the Cloud report found that 88% of organizations use or plan to use multiple clouds. In a February 2026 survey of 407 cloud-native engineers, published on the CNCF blog, 46.7% said they run two or three observability tools side by side, and only 7.4% said they have a single unified view.
Monitoring every new region and cloud
If you started with your cloud's own tools, you keep using them as you expand, with CloudWatch in AWS, Cloud Monitoring and Cloud Logging in GCP, and Azure Monitor in Azure. Each one only sees its own cloud.
If you started with a self-hosted stack, you run Prometheus, Loki or OpenSearch, and Jaeger in a separate cluster in each region, with Grafana on top. Either each cluster gets its own Grafana, or one global Grafana has a data source for every cluster. Some teams add Thanos so one PromQL query covers every region's Prometheus.
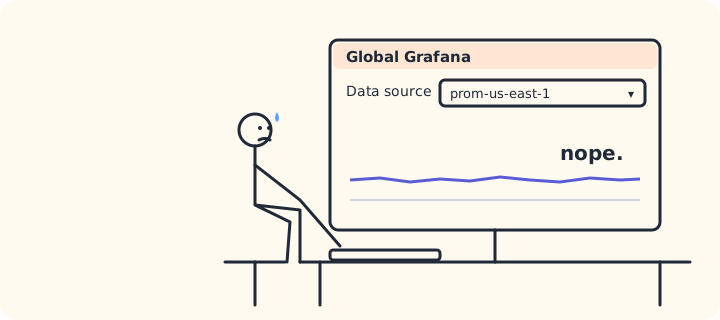
Sending all of it to one place would give you a unified view, but customers with data residency rules won't always let data leave a region or account. So most teams keep data where it's produced, and the global Grafana shows one data source at a time.
Debugging starts breaking
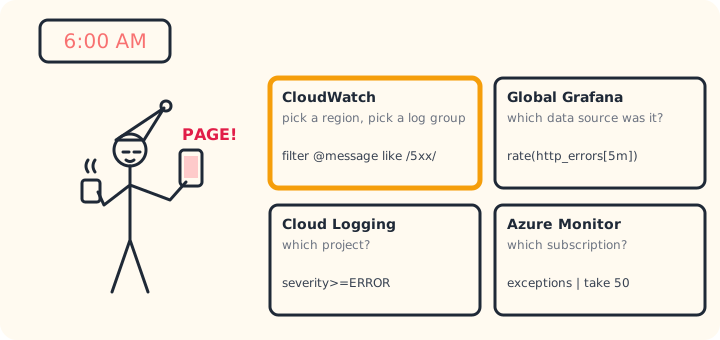
You get paged at 6am because error rates are up for a customer. You open CloudWatch, pick us-east-1 and the API's log group, and find nothing. You switch the global Grafana's data source through each region looking for the spike. It looks like it's coming from GCP, so you open the Google Cloud console, pick what you hope is the right project and start writing a Cloud Logging filter.
It's now 6:15, and you haven't looked at a single trace yet.
Why multi-cloud monitoring is hard
Every cloud collects different telemetry
Each provider decides what to collect, what to call it and how to show it. Kubernetes is the clearest example. Run the same service on EKS, GKE and AKS and you get three different views of it.
| Cluster | Default monitoring | Pod CPU shows up as |
|---|---|---|
| EKS | CloudWatch Container Insights | pod_cpu_utilization, a percentage |
| GKE | Cloud Monitoring | kubernetes.io/container/cpu/core_usage_time, cumulative CPU seconds |
| AKS | Azure Monitor Container insights | cpuUsageNanoCores in the Perf table |
The built-in dashboards are different too, with their own defaults, groupings and names for a cluster, namespace or node. A question as simple as which pods use the most CPU across all your clusters takes three queries and some unit conversion.
Alerts drift apart
The same alert, say a page when a pod restarts more than three times in ten minutes, has to be written once per cloud, against a different metric, in a different query language, routed through SNS in AWS, notification channels in GCP and action groups in Azure. Every time someone tunes a threshold in one cloud, someone has to remember to change the other two. A few months later the three rules no longer fire on the same conditions, and nobody notices until one cloud pages and the others don't.
AI makes this more manageable. An agent can translate a CloudWatch alarm into a Cloud Monitoring policy and a KQL alert rule in a minute. But you still have to check each translation, and then make sure the alert actually fires when it should, in every cloud.
Every console has its own query language
| Where you look | What you have to write |
|---|---|
| CloudWatch Logs | Logs Insights query syntax |
| Cloud Logging | Logging query language |
| Azure Monitor | KQL |
| Prometheus | PromQL |
| Loki | LogQL |
| OpenSearch | Lucene, DQL or PPL |
None of them can link a log line in GCP to the trace that started in AWS, so you match timestamps across consoles by hand.
Not everyone has access to every cloud
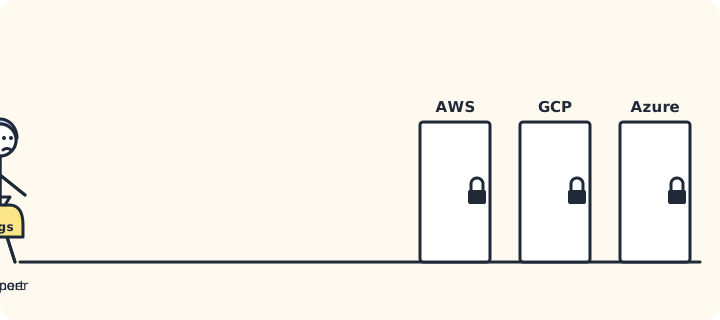
Each cloud has its own IAM, and every AWS account, GCP project and Azure subscription needs its own policies. Keeping those right across three clouds is hard, so the easiest option is to not give access at all. Support and product teams end up locked out, and every question about a customer becomes a message to an engineer.
Can't AI just query all of them?
The first reply to all of this is usually that an AI agent can run the AWS, gcloud and Azure CLIs, so let it do the querying. AI has made querying a lot easier. It hasn't removed the friction of having your data in many places.
Every source needs its own setup. AWS, GCP and Azure all have good CLIs, but each one has to be installed and authenticated wherever the agent runs, and the agent has to load how each one works into its context and work out which one to use. Then it has to correlate results from sources that don't know about each other, matching timestamps and service names the same way you would at 6am. It can work, but it's slow, and every hop is another place for it to go wrong.
Access gets riskier. The people who are locked out of a cloud are locked out for their agent too. And the credentials a cloud CLI needs to read logs and metrics usually reach much more than observability, like databases, storage buckets and the infrastructure itself. Giving an agent that kind of production access is a much bigger risk than giving it scoped access to a single observability tool.
Self-hosted stacks mean many MCP servers. Most of the open source tools offer an MCP server, but with a stack per region you connect to each one separately. The agent ends up with dozens of near-identical tools and has to work out which ones to query at the start of every incident.
You still have to check the answer. At some point someone has to verify what the agent found, by opening the logs or the dashboard it's quoting. That takes much less familiarity with each tool than writing the queries yourself, but it still takes some, and with half a dozen consoles you need to know your way around all of them.
Nobody minds how much work the agent does. But if you compared the tokens an agent spends on the same incident across a dozen CLIs and MCP servers and in one tool, I'd expect a big share of the difference to go on working out where to look, before it reads a single log line.
Why not just buy a managed tool?
After a few incidents, someone suggests buying Datadog or another managed vendor and getting everything in one place. You get a quote and send it to finance.
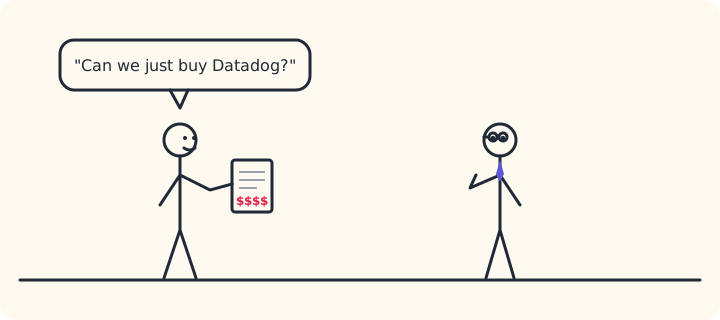
At tens of regions across three clouds, most managed vendors cost more than finance will approve. So the team stays with what it has, with a cheat sheet of query syntax and a runbook that starts with a page about which console to open first.
Frequently asked questions
What is multi-cloud monitoring?
Multi-cloud monitoring, sometimes called multi-cloud or cross-cloud observability, means collecting metrics, logs and traces from every cloud provider and region you run in, storing them in one place, and querying them one way. During an incident you can see which cloud and region a problem comes from without switching consoles.
Why aren't CloudWatch, Cloud Monitoring and Azure Monitor enough for multi-cloud?
Each one only sees its own cloud. They can't link a log in one cloud to a trace in another, and each has its own console, permissions and query language, so on-call engineers have to know all of them.
How do I monitor AWS, GCP and Azure in one place?
Run an OpenTelemetry Collector in each cloud and region, tag every metric, log and trace with the same resource attributes, such as cloud.provider and cloud.region, and send everything to one backend you can query in one language. Filter or aggregate inside each cloud before sending, so you only send what you need.