
In Episode 1, one of the lessons was to keep merges and queries apart, and I promised more on that in a future post. This is that post. It starts with two searches from one customer, and ends with AI agents.
One service, three jobs
For most of our first year on ClickHouse Cloud, we ran a single service, and it did three jobs on the same CPUs: inserting logs, merging parts in the background, and running our customers' queries. By default, ClickHouse does not give inserts or merges priority over a query. Whoever asks for CPU gets a share of it.
The incident
Late in 2025, a user ran two free-text searches over 15 days of logs, looking for one rare token, a long hex string. Within about a minute, the user's browser gave up on both. ClickHouse did not. Each search kept running for about 14 minutes. ClickHouse Cloud had not released full-text search yet, so searches like these were always slow, but they normally finished much sooner.
While the searches ran:
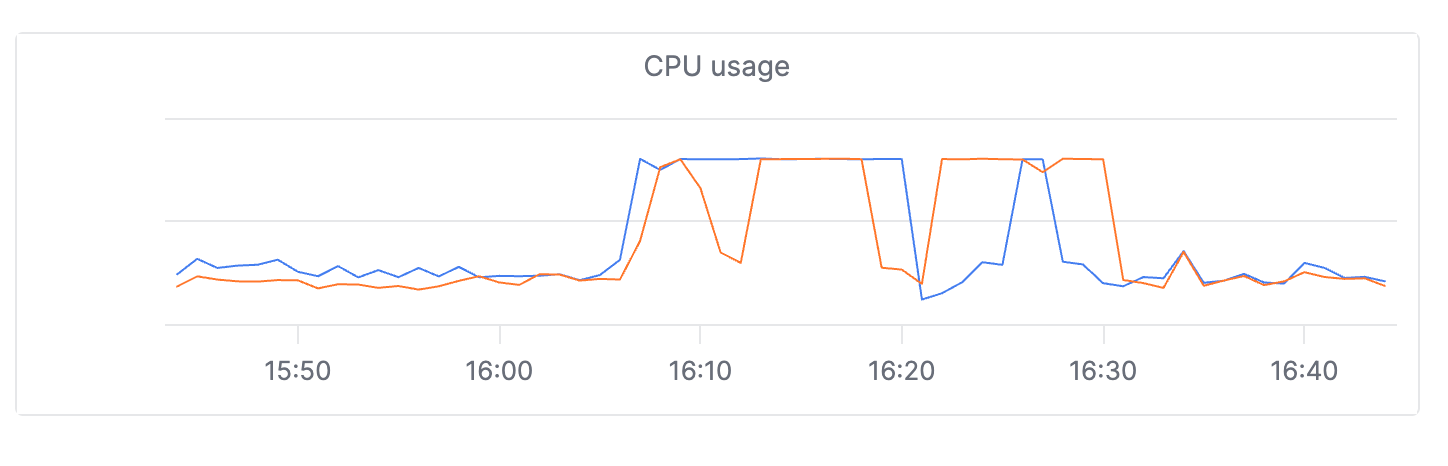
- CPU on both replicas was high, close to its limit, for most of 25 minutes.
- Running merges on one replica jumped from about 4 to 27.
- 12 inserts had been running for about 20 minutes each.
- 7.4% of all queries failed, and other customers' searches took up to 59 seconds.
Who was using the CPU?
We asked ClickHouse support. They sent us the two searches. Each had run for about 14 minutes, much longer than anything else on the service.
Here is the part I still find uncomfortable. By ClickHouse's own count, the two searches used only a small share of the CPU. CPU also stayed high for about 10 minutes after they ended.
So I can't tell you exactly how the CPU was split between the searches, the merges, and the inserts. What I can tell you is that they were all fighting over the same cores, and inserts for every customer on that service paid for one customer's search. My conclusion at the time was that an expensive search can cause ingestion errors, and that the only real fix was to stop sharing the CPU.
If I had to find those queries again, I would not wait for support. I would look for the queries that run the longest, not the ones that use the most CPU. That is how our two searches stood out. While the CPU is high, they are still running, so they are not in the query log yet. They are in system.processes:
SELECT
       hostName() AS replica, user, query_id,
       round(elapsed) AS seconds,
       formatReadableQuantity(read_rows) AS rows_read,
       formatReadableSize(memory_usage) AS memory,
       substring(query, 1, 100) AS query_start
FROM clusterAllReplicas('default', system.processes)
ORDER BY elapsed DESC
LIMIT 10;
After they end, they are in system.query_log, including the ones that failed. Again, sort by duration:
SELECT event_time, user,
       round(query_duration_ms / 1000) AS seconds,
       round(ProfileEvents['UserTimeMicroseconds'] / 1e6) AS cpu_seconds,
       formatReadableSize(memory_usage) AS memory,
       substring(query, 1, 100) AS query_start
FROM clusterAllReplicas('default', system.query_log)
WHERE type IN ('QueryFinish', 'ExceptionWhileProcessing')
  AND event_time > now() - INTERVAL 1 HOUR
ORDER BY seconds DESC
LIMIT 10;
What we changed
1. Queries got their own compute
We added a read-only service next to each production service. Both read the same storage, so there is nothing to copy. ClickHouse Cloud calls this compute-compute separation. It is a ClickHouse Cloud feature, and self-hosted ClickHouse does not have it. We pointed all queries at the read-only service. The original service, now the read-write service, kept only inserts and merges.
Without queries, the read-write service needed much less CPU at first. Over the next two days we cut one read-write service to a quarter of its size.
Two things surprised us:
- Autoscaling the read-only service was not instant. Once, while it scaled up to twice its size, its readiness checks failed and logs did not load for a while.
- Some jobs can't run on a read-only service. Our ClickHouse export job had to stay on the read-write service at first.
2. Each query got tighter limits
Every query already ran with a thread limit (max_threads) and a timeout. On a shared CPU, both were too generous. A few weeks later, another customer's 30-day query took over the read-only service. Our oncall engineer summed it up: "when a really expensive query arrives, then entire cpu is utilized for that one query leading everything else to stall." We lowered max_threads to three quarters of the cores on one replica, and set the default timeout to 60 seconds:
SETTINGS max_threads = <3/4 of vCPUs>, max_execution_time = 60
The trade-off was real. With fewer threads, some 5-day queries started to time out. Free-text search over a long range was simply expensive: a few weeks earlier, a 15-day query for a rare token had taken about a minute, even though it only matched fewer than 500 lines.
3. Then the agents came
Separate compute protected inserts from queries. It did not protect queries from each other.
In 2026, the heaviest queries came from AI agents. They ran LIKE scans over raw logs. One scan from our own agent read about 194 million rows per second. Recently, one customer's agents ran a LIKE scan over 26 hours of logs while another integration sent about 330 LIKE queries. The read-only service sat at 100% CPU for 20 minutes, and 46.7% of queries failed. Inserts were fine.
Our MCP server now limits agent log queries to 3 days. When an agent hits a limit, the error message suggests a better query.
What I would do differently
- Separate queries from inserts and merges from day 1, not after the first incident.
- Set each query's thread limit and timeout for a shared CPU. One query should never get every core on a replica, and it should time out quickly.
- Make a query die when its user gives up. The browser waited about a minute. ClickHouse kept going for an additional 13 minutes. For the HTTP interface, ClickHouse has
cancel_http_readonly_queries_on_client_close, which we never turned on. - Assume your heaviest users will be agents. They don't get bored, they don't narrow the time range, and they retry.
How far compute-compute separation can go
In ClickHouse Cloud, several services can share the same data in object storage. Each service has its own replicas, CPU and memory, and each can be read-write or read-only. We split one way: queries on a read-only service, inserts and merges on the read-write service.
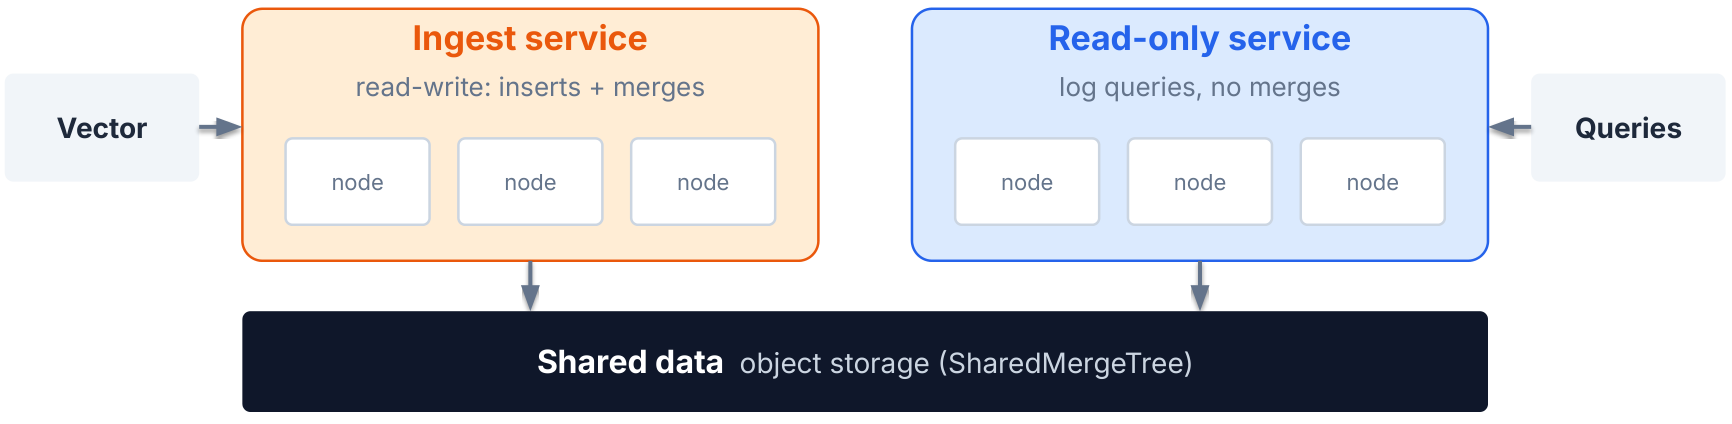
The ClickHouse docs describe one more split. Every read-write service runs background merges by default, and ClickHouse support can turn merges off on a read-write service. That lets one service take the inserts while another runs the merges, so a burst of merges does not slow down ingestion.
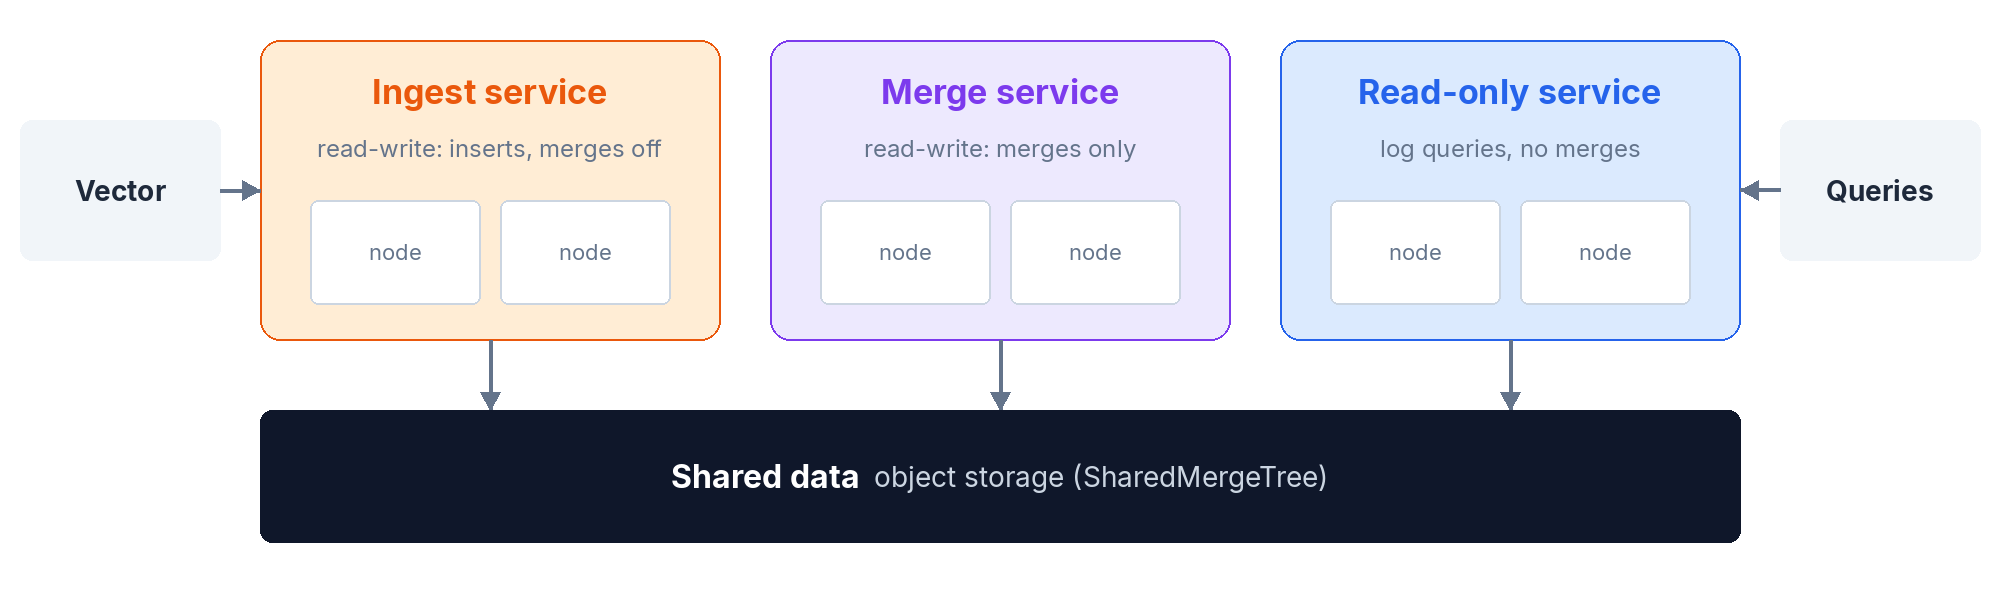
We did not do this, because two services were already too expensive for us. If you need to sustain a high ingest volume, or expect large ingestion spikes, it is worth considering.
What's next?
The new JSON column type, and why it occasionally made our queries slow. That's the next topic.