
At the end of Episode 6, I said I would come back to the JSON column type. This episode is about a log search that was slow the first time and fast the second time. Same query, same rows. The cause was one JSON column that had far more files on object storage than we thought, and a file format that was built for local disks.
Slow once, fast after that
This summer, a PoC customer told us that some log searches were slow. Not all of them, and not always. One search over fifteen minutes of logs took 6.4 seconds for them.
I ran the same SQL by hand. The first run took 11.4 seconds. The second run took 0.11 seconds. Both runs read the same rows and the same number of bytes. So the time was not spent reading data. Something was cold the first time and warm the second time.
ClickHouse has many caches, so I turned them off one by one. With the query cache, the filesystem cache, ClickHouse's own page cache and a few others all turned off, the query was still fast. Then I cleared only the mark cache, and it was slow again. So the problem was marks.
What marks are
ClickHouse stores a table as parts, and inside a part the data is stored column by column. Each column is cut into granules of a few thousand rows. A small mark file says where each granule starts. It works like a table of contents. Before ClickHouse can read even one granule of a column, it needs that column's marks. In larger parts, each column has its own data file and its own mark file. Small parts use a different layout, which I come back to later in this article.
The mark cache keeps mark files in memory. When a mark file is not in the cache, ClickHouse loads it from object storage. One load is quick. Hundreds of loads add up to several seconds.
Each replica has its own mark cache. The same query took 6.9 seconds on one replica and 0.19 seconds on the other, because only the fast one had the marks cached. The load balancer picked the replica, so the user could not tell which one they would get.
The query that found it
Clearing the mark cache by hand showed that marks mattered. To see which searches paid for cold marks, and how many marks they loaded, we looked at the query log. ClickHouse records how many mark files each query had to load (mark cache misses) and how many requests it sent to object storage:
SELECT event_time,
       query_duration_ms AS ms,
       ProfileEvents['MarkCacheMisses'] AS mark_miss,
       ProfileEvents['S3GetObject'] AS s3_get
FROM clusterAllReplicas(default, system.query_log)
WHERE type = 'QueryFinish'
  AND query_kind = 'Select'
  AND event_time > now() - INTERVAL 24 HOUR
  AND ProfileEvents['MarkCacheMisses'] > 0
ORDER BY query_duration_ms DESC
LIMIT 20;
Part of the output for our log searches on one day:
event_time            ms    mark_miss  s3_get
2026-08-31 17:39:19   8794  1583       1915
2026-08-31 17:38:30   7768   288        571
2026-08-31 17:47:06   5991   217        529
2026-08-31 14:22:12   5628   216        498
2026-08-31 13:48:31   5277   217        485
Most slow searches took about 5 seconds and had the same number of mark cache misses: 216 or 217. The two slowest had more, and the fast ones missed only a few. A number that repeats like that is not random cache churn. It is the file count of something specific. The next step was to find out which column it belonged to.
One column, 217 mark files
Our log table has a column named log, of type JSON. It holds the structured fields of each log line, such as a user ID or a request path. A simplified version of the table looks like this:
CREATE TABLE logs
(
    timestamp DateTime64(9),
    service   LowCardinality(String),
    level     LowCardinality(String),
    message   String,
    log       JSON(max_dynamic_types = 3, max_dynamic_paths = 5)
)
ENGINE = MergeTree
ORDER BY (service, timestamp);
We ran the same search twice, a few seconds apart, once without the JSON column:
SELECT * EXCEPT(log) ... -- 0.72 s,  0 mark cache misses
SELECT * ...             -- 12.19 s, 217 mark cache misses
All 217 misses came from the log column. The other columns had none.
With this type, ClickHouse gives up to 5 paths in the JSON their own subcolumns. We had lowered that limit in 2025 to work around a different slow JSON query. All other paths go into one shared area, called shared data. I assumed 5 paths meant a small number of files. When we listed the files of one merged part, we got this:
- The 5 paths with their own subcolumns: about 22 files.
- Shared data: 195 files. ClickHouse splits shared data into 32 buckets, and each bucket has 6 files, which is 192, plus 3 more for the column as a whole.
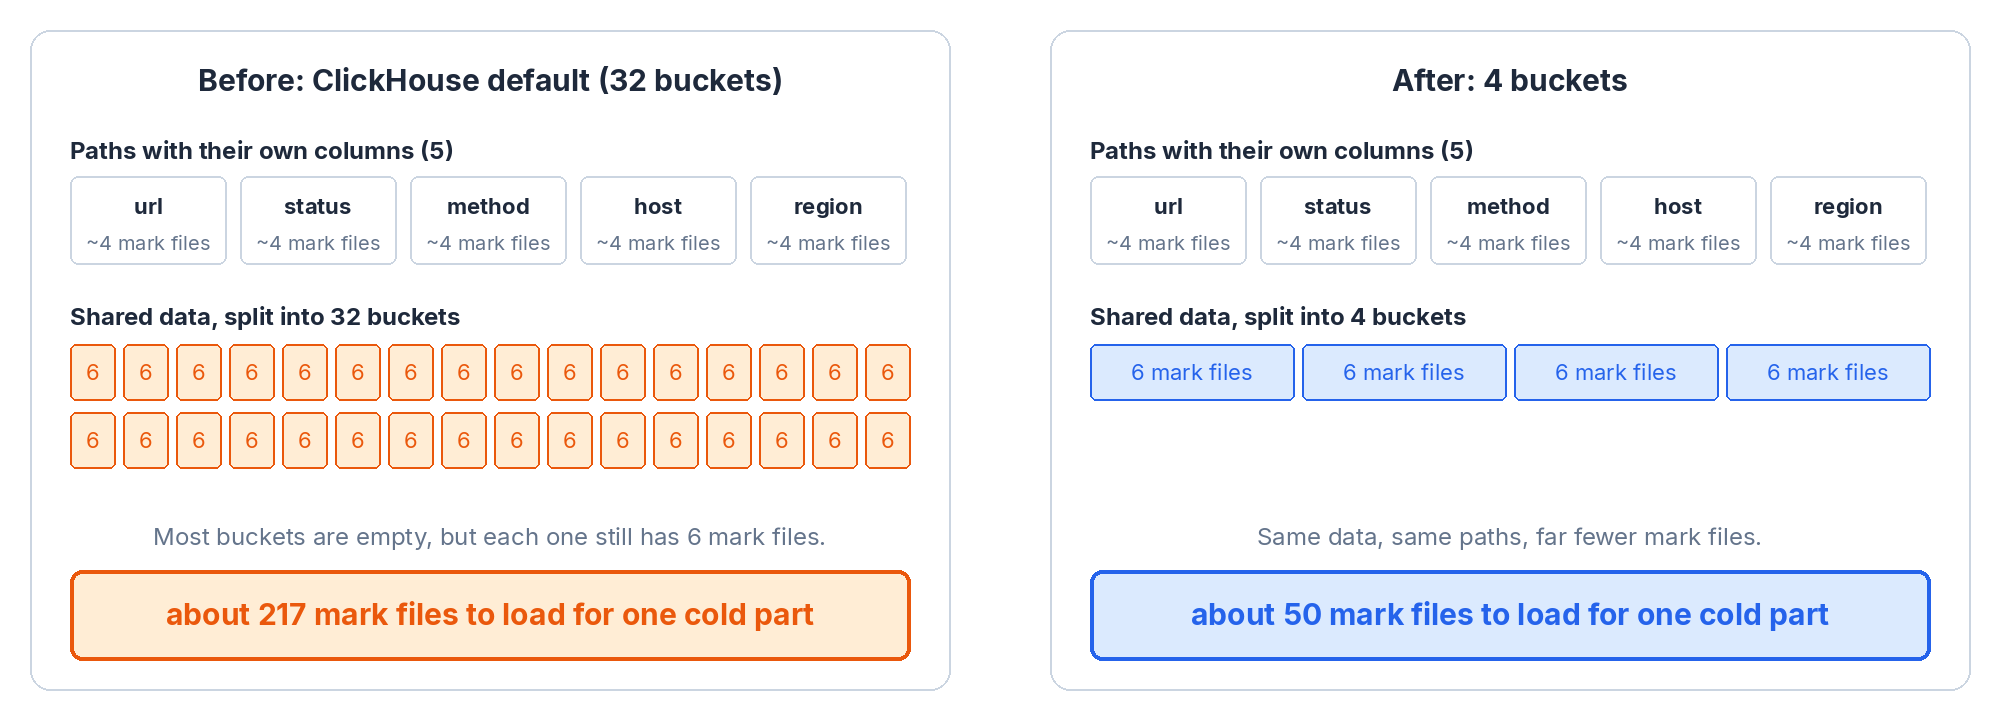
Every bucket gets its files, even when it holds almost nothing.
The buckets make a query on one rare path, such as WHERE log.user.id = '42', read one bucket instead of all of the shared data. Our searches never did that. They filtered on the plain columns and returned the whole log column. So every cold part cost us close to 200 mark files. And 32 buckets is the ClickHouse default. We had not misconfigured anything.
The fix: fewer buckets
Initially, we added a refreshable materialized view that read one granule of the log column in every part, on every replica, every 15 minutes. That loads all of the column's mark files. The median search dropped to 94 ms, but the 99th percentile stayed at about 10 seconds. Any part merged after the last run was still cold.
The real fix was the bucket count. It is a table setting. The defaults are 32 for Wide parts and 8 for Compact parts. We set both to 4:
ALTER TABLE logs ON CLUSTER default
MODIFY SETTING
    object_shared_data_buckets_for_wide_part = 4,
    object_shared_data_buckets_for_compact_part = 4;
Two parts of about the same size, one written before the change and one after, had 218 and 50 files for the log column. Over the next day on the customer's table:
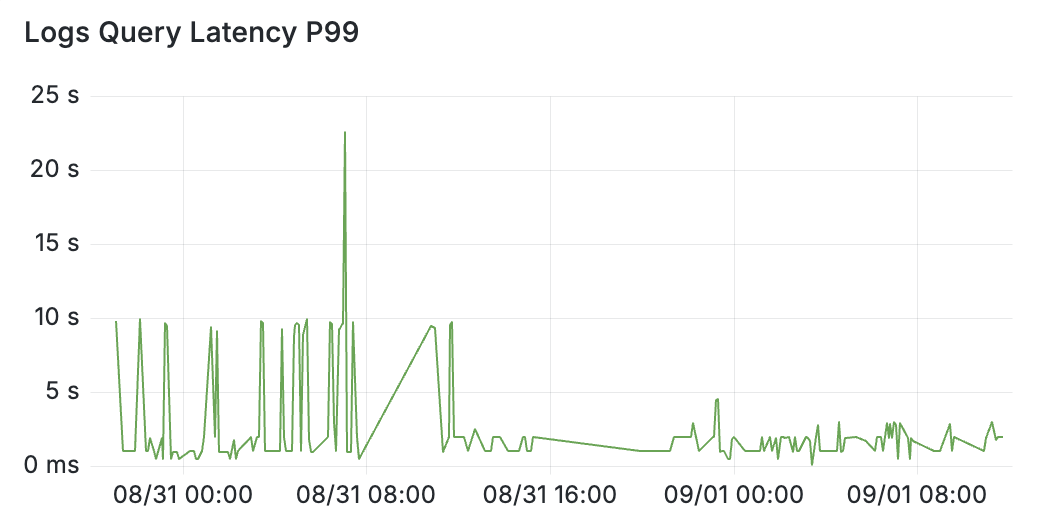
99th percentile latency of the customer's log searches from August 30 to September 1. We changed the bucket count on August 31. The 10-second spikes stop after that.
The setting applies only to parts written after the change, which were exactly the parts the slow searches hit. Older parts keep 32 buckets until a merge rewrites them, and the warmup keeps covering them.
Does this make a query on one path, such as log.user.id, slower? The 5 paths with their own subcolumns are not affected. A path in shared data is now in one of 4 buckets instead of one of 32, so ClickHouse reads more data to find it. Our shared data is almost empty, and in a local test reading one path took about the same time with 4 buckets as with 32. If you often query single paths from a busy shared data, test before you use these settings.
Newer ClickHouse versions help: a full read of a JSON column now loads fewer mark files, and SYSTEM PREWARM MARK CACHE now includes the JSON files. As I write this, our ClickHouse Cloud services run 26.6, so we do not have the prewarm fix yet. It is the same gap I wrote about in Episode 6: the fix is in an open-source release, and we wait for it to reach ClickHouse Cloud. And an open issue tracks what is left: a cold read still makes one trip to object storage per file.
ClickHouse part layout and how it evolved
The 217 mark files only exist because of how a part is laid out on disk. That layout has changed several times, each time to fix a different problem.
When ClickHouse was open-sourced in 2016, data lived on local disks. A part was a directory with one data file and one mark file per column. On a local disk, that is cheap: opening one more small file costs little, and the operating system keeps recently read files in memory.
In 2020, ClickHouse added a second layout, called Compact. All columns of a part share one data file and one mark file. The reason was small, frequent inserts: with a file per column, every small insert into a table with many columns wrote many tiny files. The original layout got the name Wide. A table setting, min_bytes_for_wide_part, decides between the two. In open-source ClickHouse, parts below 10 MiB are Compact, and bigger parts are Wide.
Then data moved to object storage, where every file is an object and every cold read of a file is a request. ClickHouse Cloud keeps all data in object storage, and in 2023 it introduced SharedMergeTree, where all replicas read the same parts. ClickHouse Cloud also changed two things for parts. It raised the Wide limit to 1 GiB, so more parts keep the Compact layout. And it added a second choice, Packed or Full. A Packed part stores all its files as one object. A Full part stores each file as its own object. On our services, parts below 128 MiB are Packed. So a part ends up in one of three shapes:
- Below 128 MiB: Compact and Packed. One object.
- From 128 MiB to 1 GiB: Compact and Full. A few objects, with one mark file for the whole part.
- Above 1 GiB: Wide and Full. A data file and a mark file for every column, each its own object.
The JSON type added one more layer. In a Wide part, every subcolumn of a JSON column and every shared-data bucket gets its own files. With 32 buckets, ClickHouse's default since late 2025, one JSON column becomes about 217 mark files. In a Compact part, the same column still shares the one mark file.
All of these limits are measured on uncompressed data. At one terabyte of logs per day, about 1 GiB of uncompressed logs arrives every minute or two. Inserts start as small Compact and Packed parts, and within minutes a merge combines them into a part above 1 GiB, which is written as Wide. Every merge writes a new part, and nothing has read its mark files yet. New parts arrived more than once a minute, so the newest end of the customer's log table almost always had a fresh, cold, Wide part with 217 mark files for the log column. That is exactly where log searches look.
Why can't ClickHouse Cloud just use Compact and Packed?
Behind that question is a bigger one: why does SharedMergeTree, built for object storage, still use a part layout built for local disks? I can only guess. Merges, mutations, data skipping indexes and projections all work on this layout, and open-source ClickHouse and ClickHouse Cloud share it. A new format would mean rebuilding much of the engine and moving every existing table. Packed storage looks like a step in that direction, one part size at a time.
It is hard to make one format that is the best choice for both local disks and object storage. You can't hit two birds with one stone. Formats designed for object storage from the start take the other side of the trade. Snowflake's table files, described in its SIGMOD 2016 paper, live on S3 and hold all columns in one file, with a header that lists where each column starts. A query reads the header, then fetches only the columns it needs with ranged reads. Parquet was not built for object storage. It came from Hadoop. But it has the same shape: all columns in one file, and the index in a footer. A cold read of such a file starts with one small read, not one request per column.
What's next?
In the next episode, I will look at data skipping indexes for log search: how a free-text search over a JSON column turned into a full scan, and what a String copy of the log with a data skipping index can skip, and what it cannot.