TL;DR
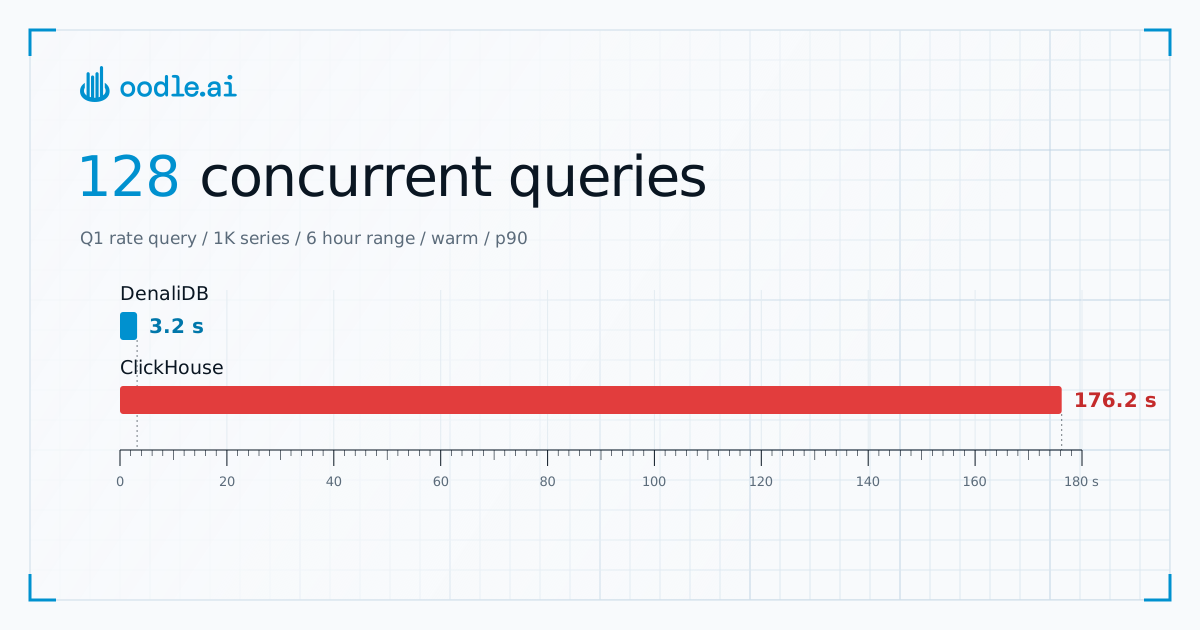
I could not complete a benchmark of ClickHouse's TimeSeries engine at 5M series. Writes were slow, its series cache duplicated labels, and queries slowed down as that grew.
What is the TimeSeries engine?
In September ClickHouse announced a TimeSeries table engine with PromQL support. It stores labels once per series and samples in a separate table, which is the right shape for metrics. ClickHouse also realized metrics data has to be handled differently from realtime analytics :)
It's still in private preview. I tried benchmarking it in an earlier, smaller run than my ClickHouse benchmark (5M series, on the same kind of single node) but was not able to complete this benchmark.
Issues I ran into
- No OTLP yet. It only takes Prometheus remote write. ClickHouse's OpenTelemetry pipeline doesn't write to it, so OpenTelemetry collectors have to convert to remote write first. This costs extra compute at scale.
- Slow writes. Each remote write request took 200 to 365 ms on the server. It needed 48 collectors to keep up where ClickHouse's OpenTelemetry tables needed 16, and with fewer the collectors dropped data.
- Duplicate tags. Its default series cache holds about 728K series. With 5M series, most writes miss it and store the labels again: 595M tag rows for 5M series after a few hours.
- Queries slow down as that grows. A 1 hour query over 2,500 series went from 1.3 to 12 seconds within an hour.
- Available compute not effectively used. PromQL evaluation used about 2 of the server's 63 cores.
- No docs for tuning it. The cache settings aren't documented and there are open bugs against them.
I'm looking forward to benchmarking against this engine once it is GA! And has more documentation on how to tune it :)