
I was asked about materialized views (MVs) recently, so this episode is about them. We use them for one job: counting logs. Every log search shows a histogram of how many logs matched over time, and counting raw logs for every search is expensive. So we count them once, on insert, and store the counts.
That part worked. The hard part was keeping the counts right. This post is about the ways ours went wrong.
Why we counted ahead of time
We added MVs from the very beginning because of how our log search page (similar to Kibana and OpenSearch Dashboards) works. A search does more than list log lines. Here is the page on our public playground, play.oodle.ai.
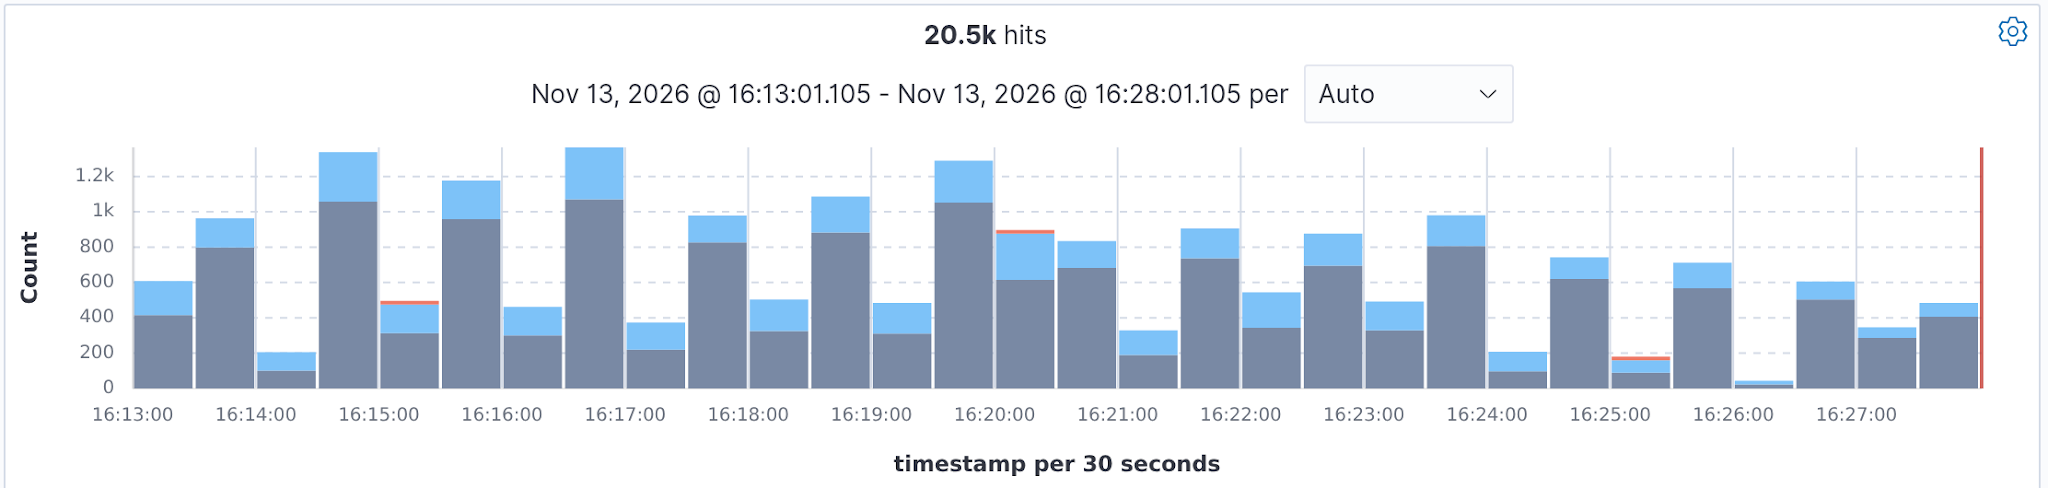
The histogram above the log lines counts the matching logs in each time bucket. Without an MV, every search runs a query like this on the log table:
SELECT intDiv(toUnixTimestamp64Milli(timestamp), 30000) AS bucket,
       count() AS n
FROM logs
WHERE timestamp >= now() - INTERVAL 15 MINUTE
      AND container_name = 'payment'
GROUP BY bucket
ORDER BY bucket;
It reads every matching log in the range just to draw the bars, so a search over the last week reads every log in that week. An MV in ClickHouse runs on each insert and writes its result to another table, its target table. Our MVs write log counts, so our query translator can rewrite the same query to read stored counts from the 5-second target table:
SELECT intDiv(toUnixTimestamp64Milli(timestamp), 30000) AS bucket,
       countMerge(log_count) AS n
FROM logs_five_seconds
WHERE timestamp >= now() - INTERVAL 15 MINUTE
      AND container_name = 'payment'
GROUP BY bucket
ORDER BY bucket;
The log table has one row per log. The 5-second table has one row per 5 seconds for each combination of values in the MV's columns, such as container name and log level. If a container writes 10,000 info logs in 5 seconds, the log table gets 10,000 rows and the 5-second table gets one. For a search over a week, the translator reads the hourly table, which has even fewer rows.
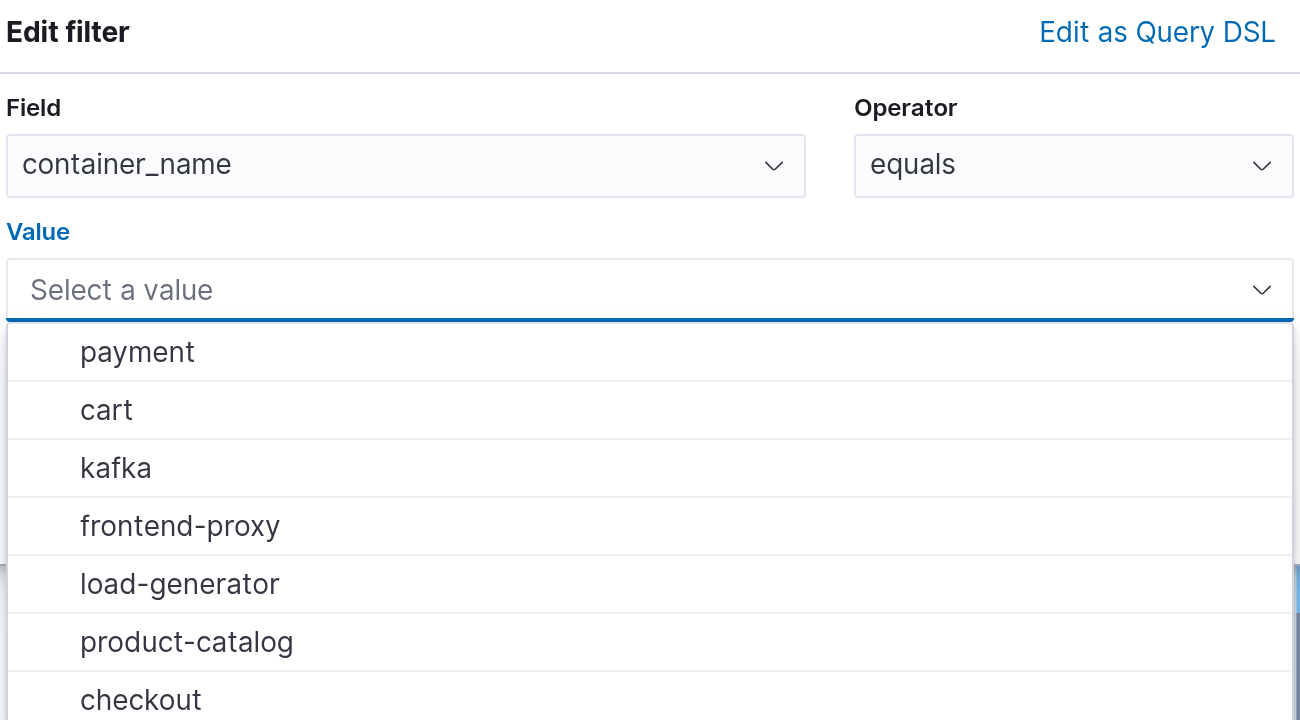
The second use is value suggestions. When a user adds a filter, the UI suggests values for the field, the most common ones first. To build the list, it asks for the top 10 values of the field with their counts:
SELECT container_name, count() AS n
FROM logs
GROUP BY container_name
ORDER BY n DESC
LIMIT 10;
On the log table, that is a GROUP BY over every log. The translator sends it to the hourly table instead, where each value appears at most once per hour, with its count already added up:
SELECT container_name, countMerge(log_count) AS n
FROM logs_one_hour
GROUP BY container_name
ORDER BY n DESC
LIMIT 10;
Both queries need only the timestamp and a few fields, and the same fields came up in almost every search. That is the case an MV is built for: count once at insert, then answer every search from a much smaller table. Later, we also used the counts to narrow the query for the log lines, as section 2 explains.
How our MVs work
Each log table has a chain of target tables: counts per 5 seconds, per minute, per 10 minutes and per hour. An MV fills each one. The 5-second table is filled from the log table, and each larger one from the one before it. The target tables use AggregatingMergeTree, so the counts are stored as aggregate states and combined when parts merge.
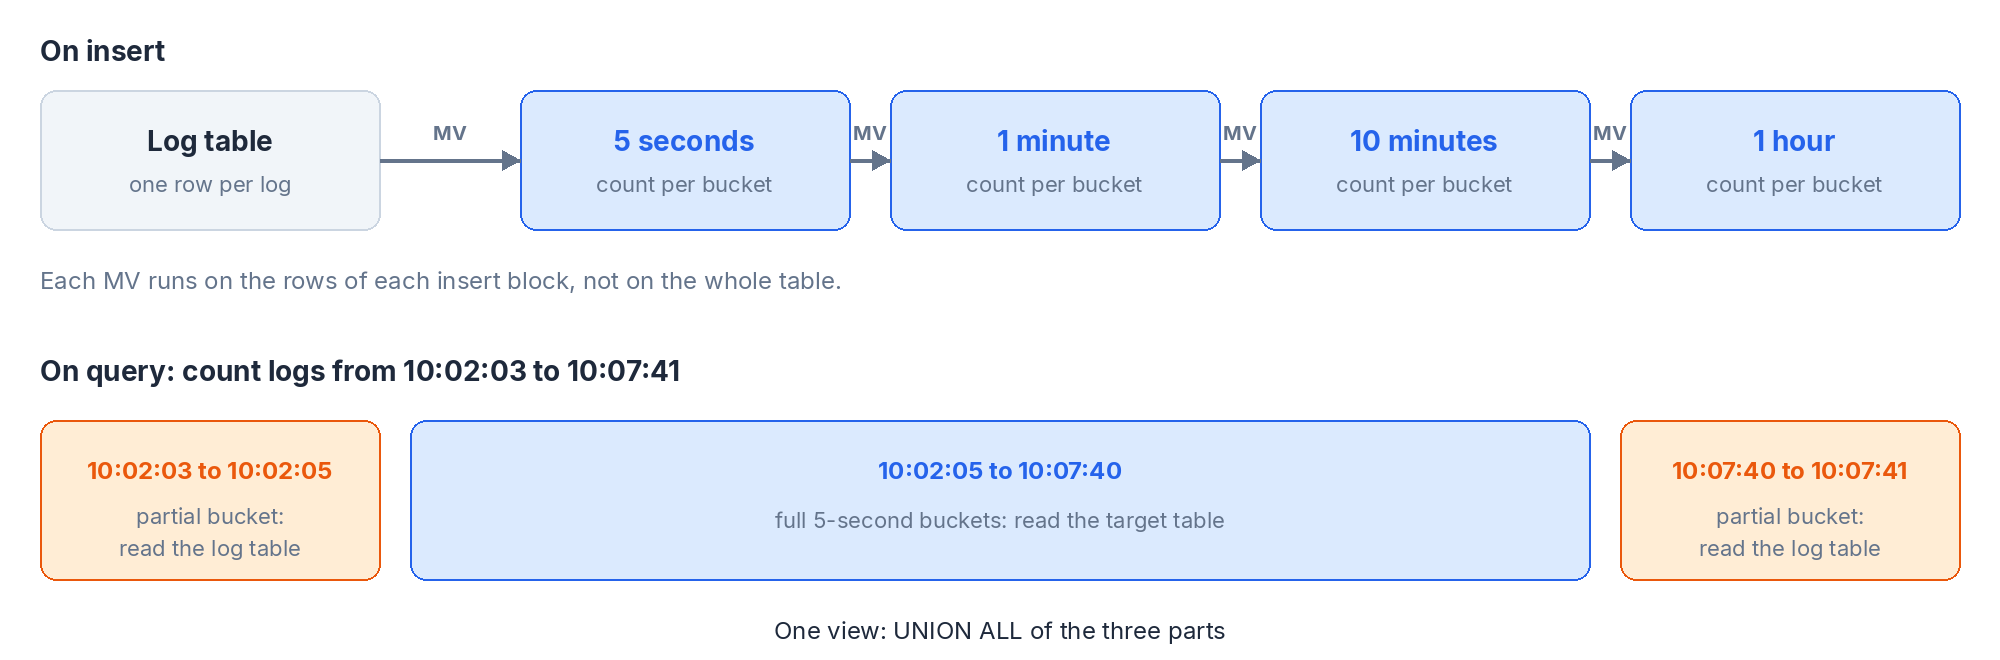
Counts are written on insert. A query reads the target table for full buckets and the log table for the partial ones at each end.
Our query translator picks the right table. When a user searches the last 15 minutes, the histogram reads the 5-second table. For the last week, it reads the hourly one.
We are not the only ones who count logs ahead of time. PostHog's logs product keeps a projection with counts per minute on its log table for the histogram, and an MV with counts per 5 minutes for its filter counts. ClickStack, the observability stack from ClickHouse, lets users register their own MVs to speed up the histogram on the search page.
1. The totals matched, the filters did not
A user reported that the histogram did not match the log lines on the page. They had searched for one request ID: the page listed 3 matching logs, but the histogram, which reads the 5-second table, showed 0.
The cause was in the schema: the ORDER BY of the target table and the GROUP BY of its MV had different columns. In AggregatingMergeTree, the ORDER BY is also the merge key, so merges combined rows that the MV had kept apart. No count was lost, so the totals were right, but the counts landed on the wrong timestamps and field values.
At the time, I could not find a warning note about this in the ClickHouse docs, and ClickHouse support could not give us an answer either. What finally helped was Everything you should know about materialized views, a talk by Denis Zhuravlev, a long-time ClickHouse DBA, published with his notes under each slide. ClickHouse has since added this rule to its own list of common mistakes: "The ORDER BY clause of the target table must be consistent with the GROUP BY of the SELECT clause in the materialized view."
The fix was not quick. You cannot change a table's ORDER BY to a new set of columns in place. We created new target tables with the right key, backfilled them from the log table, and switched the translator over.
2. The newest minutes
Sometimes users saw an empty page when they searched the last 15 minutes, while the last 30 minutes showed data. Refreshing a few times made the logs appear.
To explain why, I need to show how we use the counts to find log lines. The page lists the newest 500 matching logs. Instead of scanning the whole time range for them, the translator first reads the histogram counts from the 5-second table. It walks back from the newest bucket until the counts add up to 500, and then runs the query for the log lines only over that shorter range. For a search over the last day, the log query often reads only the last few minutes.
When we compared the log table with the 5-second table minute by minute, older minutes matched. The last 2 to 5 minutes did not: the target table was behind the log table. The translator saw too few logs in the newest minutes, so it searched the wrong range, and the page showed nothing at all. We never found the root cause, and ClickHouse support could not find it either.
Since we could no longer trust the counts for the newest data, the log query now covers the larger of two ranges: 10 minutes, or the range computed from the counts. Users no longer got an empty page, but it had a cost: on a busy table, 10 minutes is a lot of logs to read, and the search page got noticeably slower. In one of our largest tables, we later had to lower the 10-minute minimum to 1 minute.
Agents do not group by fixed columns
When we built the MVs, we assumed all count queries came from people using our UI.
That assumption is no longer true. More and more users query logs only through MCP, with an agent. An agent does not stick to a few fixed columns in its GROUP BY. It groups by whatever field fits the question. Keyword search has also become more frequent, and an MV cannot answer a keyword search, because its target table does not store the log text.
We looked at three days of count queries in one of our production deployments. 74% came from agents through MCP, and only 26% from people using the UI. At most 1 in 7 of the agent queries could have used an MV. The rest searched for a keyword. And 1 in 7 is only an upper bound: in practice, the columns agents group by are often not in the MV tables at all.
How to check your own MVs
Compare the log table with the target table per minute, with a filter:
SELECT b.minute, b.n AS base, r.n AS mv
FROM (
  SELECT toStartOfMinute(timestamp) AS minute, count() AS n
  FROM logs
  WHERE timestamp >= now() - INTERVAL 2 DAY AND timestamp < now() - INTERVAL 1 HOUR
    AND container_name = 'api'
  GROUP BY minute
) AS b
LEFT JOIN (
  SELECT toStartOfMinute(timestamp) AS minute, countMerge(log_count) AS n
  FROM logs_five_seconds
  WHERE timestamp >= now() - INTERVAL 2 DAY AND timestamp < now() - INTERVAL 1 HOUR
    AND container_name = 'api'
  GROUP BY minute
) AS r USING (minute)
WHERE b.n != r.n
ORDER BY b.minute;
What I would do differently
First of all, I do not recommend an MV unless you know exactly which columns users will group by, and you know that list will not change. Adding a new column means rebuilding the whole chain of MVs. It is a lot of manual work.
If you still need one:
- Make the ORDER BY of an aggregating table the same as the GROUP BY of its MV, from day 1. It is the one MV mistake that is expensive to undo.
- Keep the columns in the MV low cardinality. Otherwise the target table grows large, and the MV no longer saves much.
- Use as few levels as you need in a chain of MVs. Every level is another table written on each insert.
- Test with filters and with many logs per bucket, not only with totals on a quiet table. Our first bug passed a total-count check.
What's next?
In the next episode, I will write about the JSON column type, and how a wide JSON column made some of our log searches slow.