TL;DR
- Most Datadog cost cuts reduce the data you can search. Common cuts include sampling traces, not indexing logs, shortening retention and dropping tags.
- The savings show up on the bill. The cost shows up later, in slower debugging and issues nobody can explain.
- AI agents now often take the first look at an incident. They can only use the data you kept.
- Cut telemetry that has no value. Keep enough to find the cause of an issue quickly.
Datadog earned its place. The UX is great, the integrations just work, and the dashboards are useful on day one. Going from a metric to a trace to a log takes a couple of clicks. Adoption is easy, so usage grows fast. Every part of it is priced at a premium, so Datadog soon becomes the second-largest bill after infrastructure.
From there, teams split into two groups. The first group pays for everything. They have been burnt by other tools before, so switching feels riskier than paying the bill.
From a contractual perspective, we were kinda locked in a situation where we were spending a lot more than we wanted.
– Senior Director, cybersecurity company serving 2,000+ enterprises
The second group pays for less data. They sample, filter, shorten retention and switch things off until the bill fits the budget. If you keep optimizing your Datadog account, this post is about what those cuts might be costing you.
Cost problems rarely look like cost problems
Have you ever done any of the following?
- Cut log retention to under 7 days.
- Turned off telemetry in dev and staging.
- Skipped custom metrics for your own product, or removed a
customer_idtag because of cardinality. - Lowered your trace sample rate.
- Indexed only errors and a sample of everything else.
- Dropped INFO logs at the agent, or told developers to log less.
- Spent time, again, finding out which team is driving the Datadog bill.
- Stopped to ask what a new log line or label would cost while building a feature.
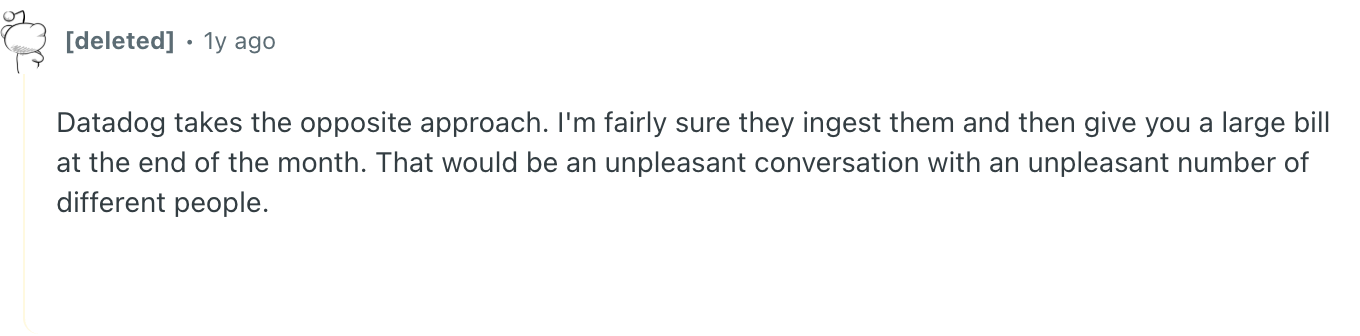
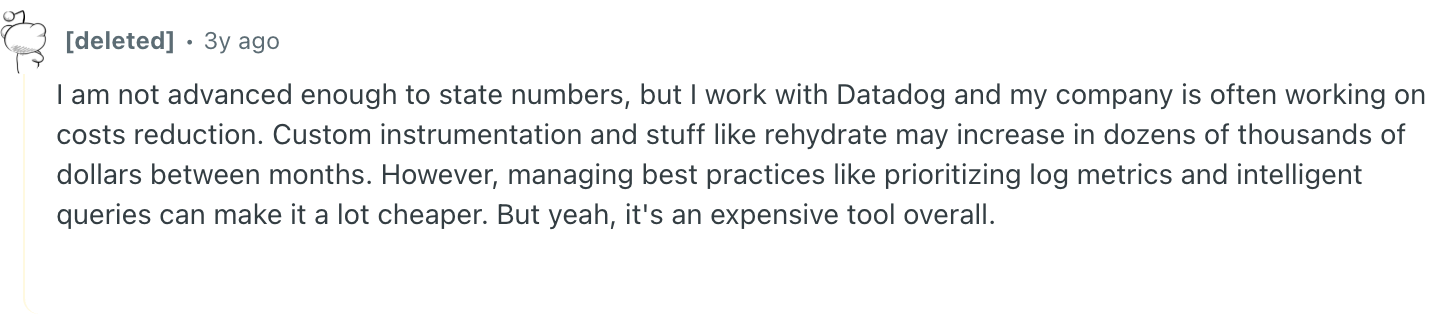
If you checked more than a few, cost is deciding what data you collect. Most of these cuts start after a surprise bill. Here is how one r/devops commenter put it.
The last item on the list costs the most, because it happens every day. When engineers worry about what a log line or a label will cost, they stop adding them. You find out in the next incident, when the signal you need is not there.
What each optimization takes away
Metrics can't tell you which customer is affected
In Datadog, every unique tag combination counts as a separate custom metric. Add customer_id to a latency metric, and your series count is multiplied by the number of customers. So teams remove it. When latency goes up, you see it. You just can't tell whether it affects everyone or one large customer. You can't alert on errors for customer X, so you hear about it from customer X.
Teams that only use default infrastructure metrics also can't see the impact on the business. A CPU chart tells you a node is busy. It doesn't tell you checkouts dropped by a third. A simple custom metric with the right tags would have shown that.
Traces drop the request your customer is asking about
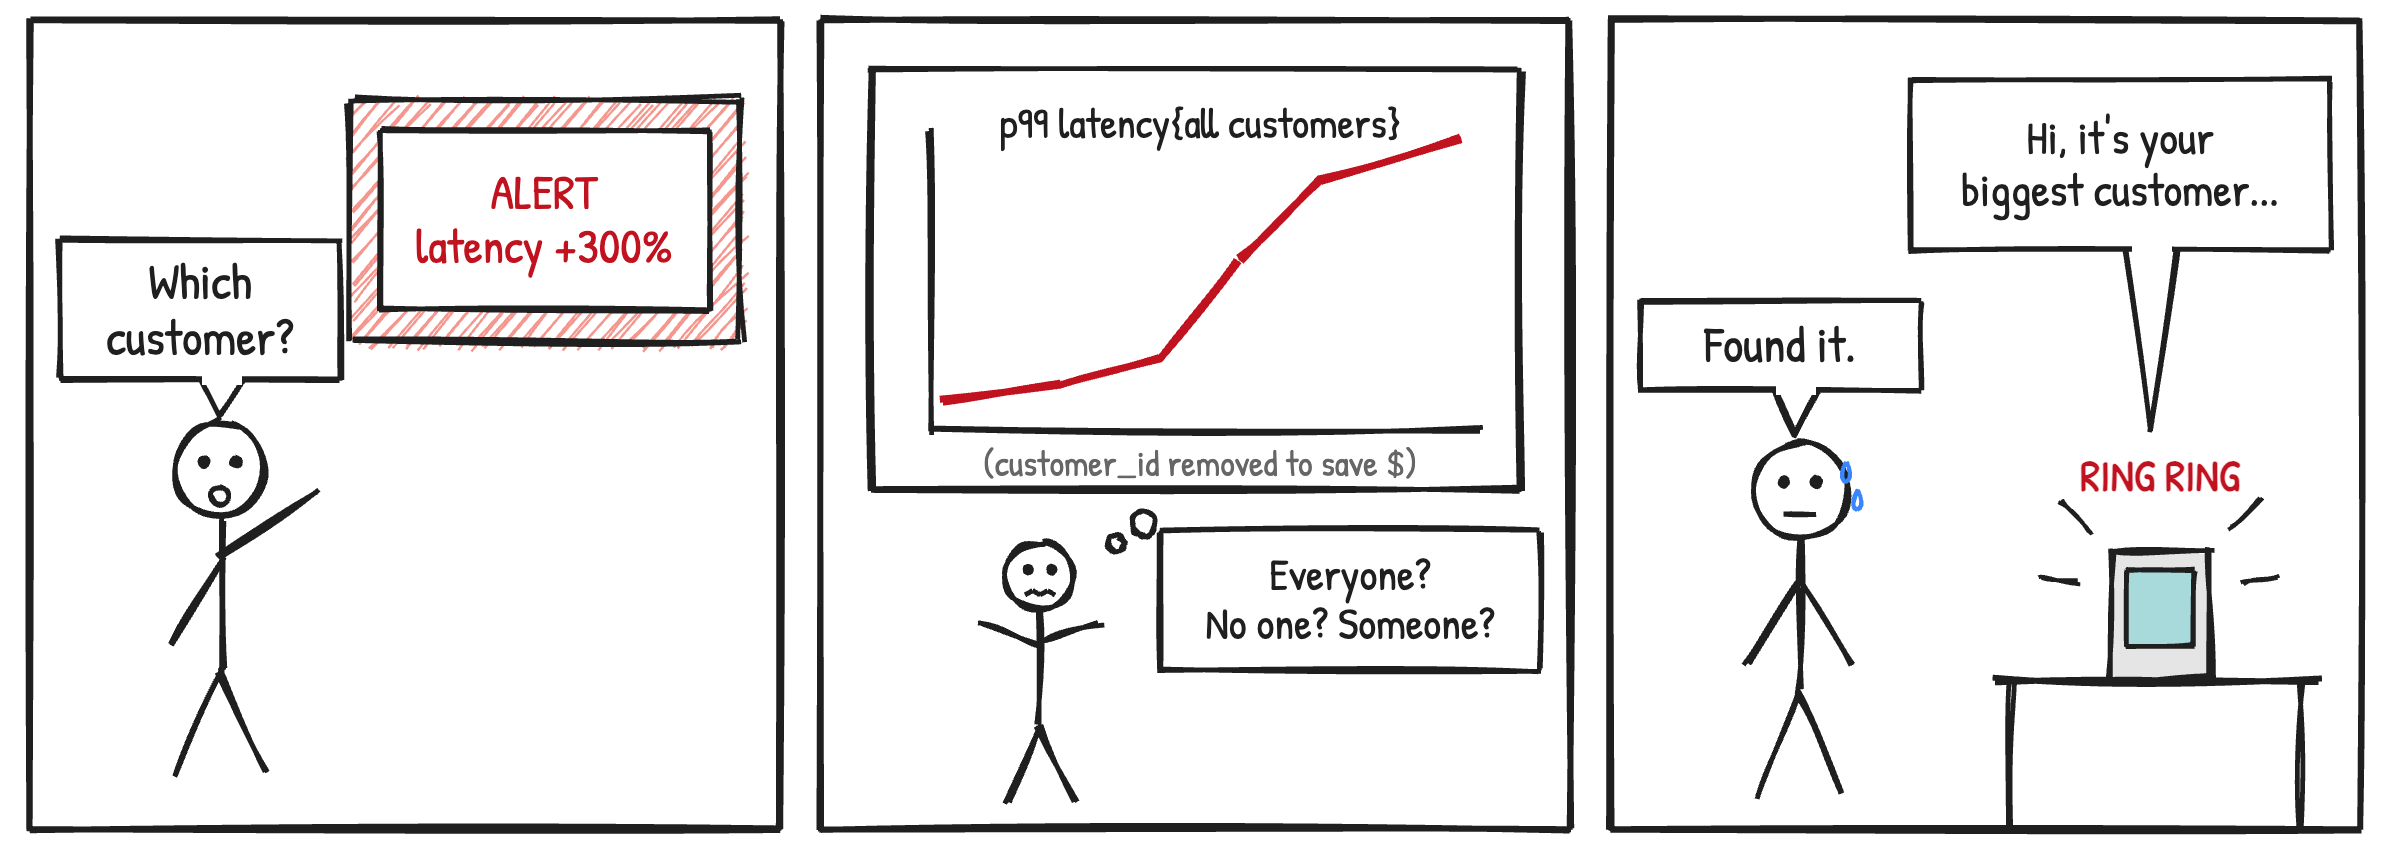
Every span beyond the included allowance costs money, so teams sample. By default, the agent keeps about 10 traces per second. Tail sampling keeps errors and slow requests. But when a customer says checkout was slow at 2:14 pm, their request was usually neither an error nor slow enough to keep. And if you only keep bad traces, you have nothing normal to compare them with.
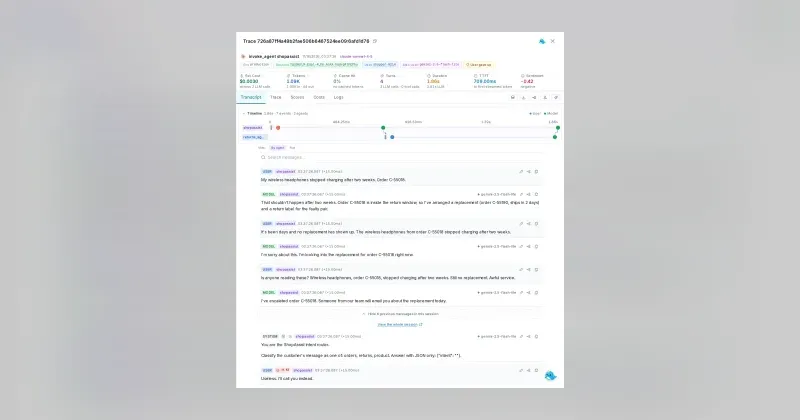
AI agent traces are even harder to sample. Agent failures rarely show up as errors. The agent misreads a question, picks the wrong tool or makes up an answer. You can't filter for those runs, so sampling drops them along with everything else.
Fewer logs are searchable, and they are deleted sooner
Most of the log bill is indexing, so teams index less. One r/sre commenter describes a common setup, "Sampling logs, rum, etc for non errors (ex: 2xx/info logs are at 25% or less) errors are always 100%." That means three out of four normal requests have no logs you can search. It works until a customer reports a problem that never threw an error. Also, once you hit a daily quota, logs stop being indexed for the rest of the day. That is often the day something is going wrong.
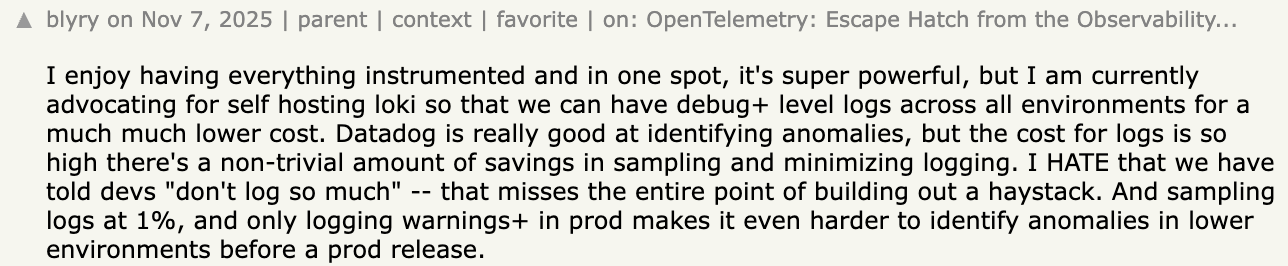
Teams also tell developers to log less. As a result, the line that would explain the next incident never gets written. One engineer on Hacker News feels strongly about this.
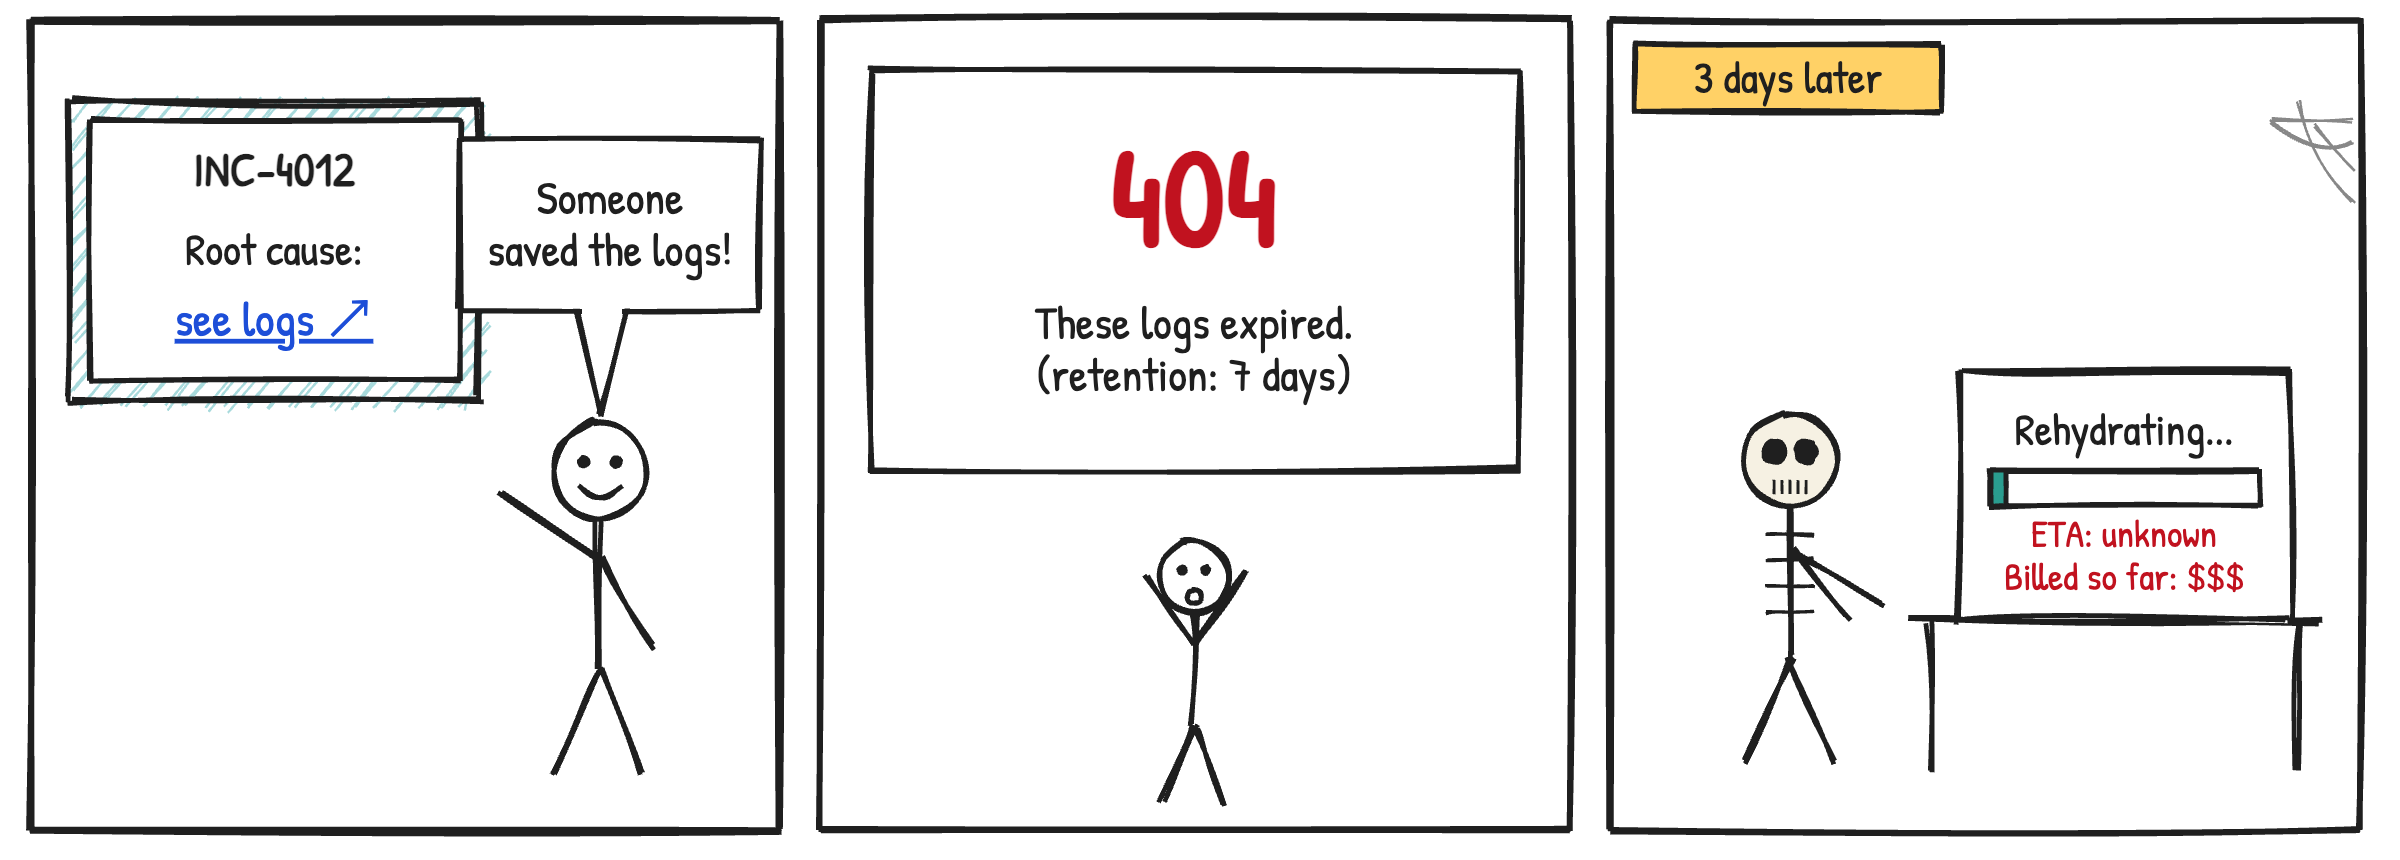
Short retention deletes logs you still need. With seven days of logs, you can't tell whether an issue has happened before. For example, every Jira ticket that linked logs as evidence for an investigation no longer has any data behind it. You can archive logs and bring them back later, but rehydration charges for every GB scanned in the time window. You pay even if you cancel, and there is no promised finish time. So teams only rehydrate for big incidents, and the bill still surprises them.
Less coverage means bugs show up in production
RUM is priced per session, so most teams sample sessions and turn off Session Replay. That is fine for trends. It is not fine when one customer reports a broken flow. Dev and staging are the easiest environments to switch off, so bugs first show up in production. Per-host pricing also makes autoscaling more expensive. One r/sre commenter found that better autoscaling was "overall lowering our infra fees but causes [our] DD fees to go up." At that point, the monitoring bill decides how you run your infrastructure.
AI agents can't debug what they can't see
More and more, an agent takes the first look at an incident. It reads the alert, pulls metrics, traces and logs, and gives a human an answer to check. That means the agent needs complete telemetry.
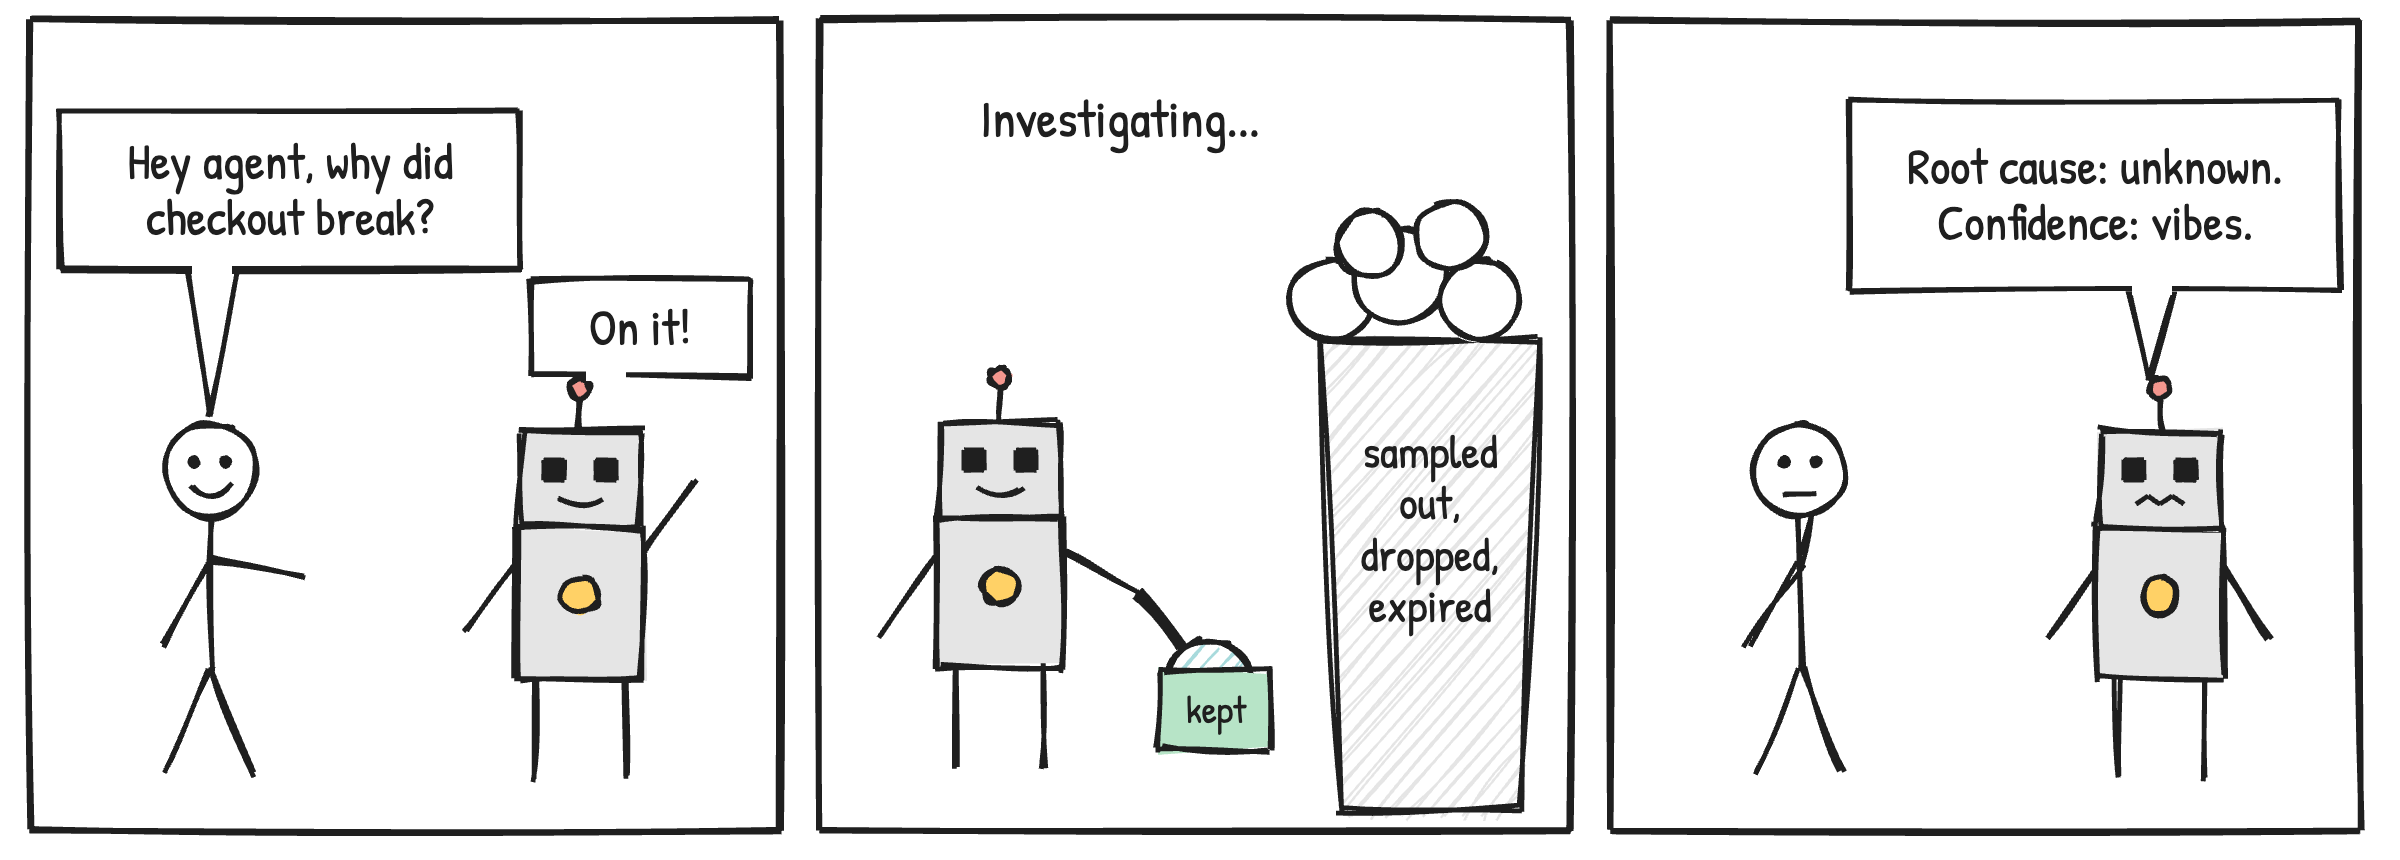
- An agent only knows what you kept. A dropped tag, a sampled trace or an excluded log never existed for the agent. This is true for Datadog's Bits AI and for your own agent over MCP.
- Agents need history. Good investigations use past incidents and the tickets that link to their logs. With short retention, the logs behind those links are deleted. An agent investigation takes minutes, but a rehydration can take hours, with no ETA.
- Confidence needs coverage. "The database is slow" is not very useful. "This customer's requests are slow because of this query, starting with this deploy" is. That answer needs per-customer metrics and complete traces.
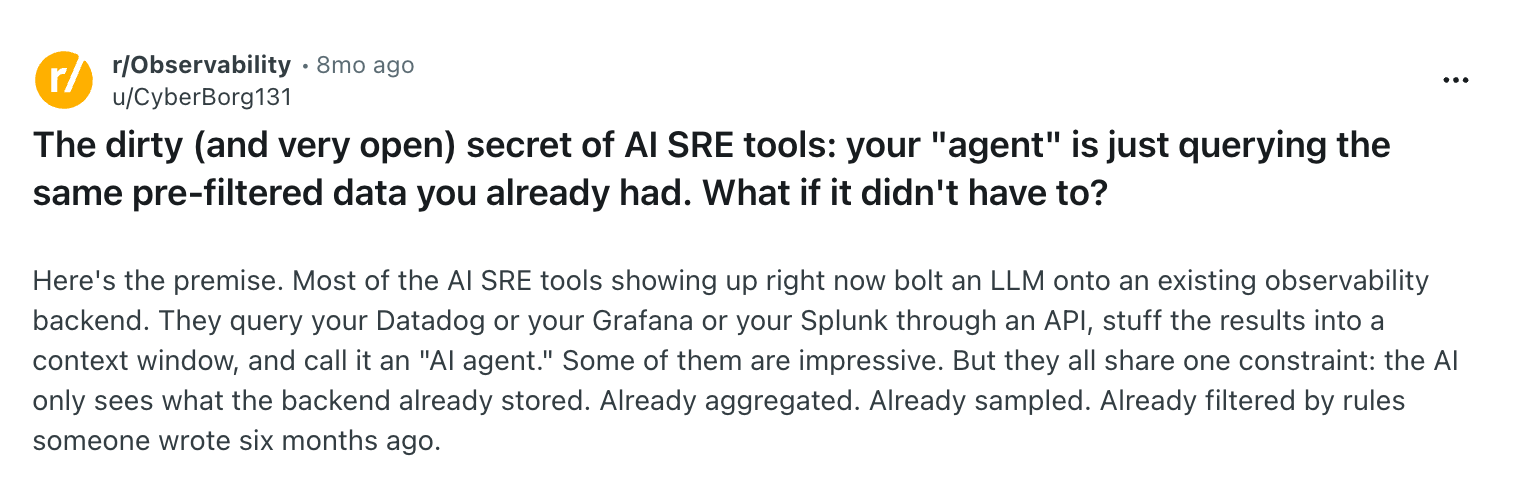
This r/Observability post says it well.
Sufficient telemetry, not all telemetry
This doesn't mean you should keep everything forever. If telemetry has no value, or repeats another signal, remove it. That is a good cut. For most teams, enough telemetry looks like this.
- Custom metrics on important APIs and workflows, with a
customer_idlabel. - Traces on every important operation.
- Logs that record the status of key steps.
- Debug logging you can turn on without paying a penalty.
- Retention based on how far back you need to look, not on the bill.
Now go back to the checklist. For each item you checked, ask one question. If we had an incident there tomorrow, would we have the data to find the cause? If not, the bill didn't really go down. The cost moved into longer incidents and unhappy customers.