An AI agent gives a customer a wrong answer. The same week, the model bill comes in much higher than last month. In both cases the first question is the same: which request caused it?
Most teams can't answer that quickly. Every app logs its model calls a little differently, if it logs them at all. And finance wants spend by team, in a format nobody planned for.
So TrueFoundry and Oodle built an answer at the one place every model call already passes through: the AI gateway.
That is what AI observability means in practice: a record of what each model and agent call did, how long it took, what it cost and where it failed.
What the TrueFoundry AI Gateway does
The TrueFoundry AI Gateway sits between your applications and the models they call. Teams reach 1,600+ models through one OpenAI-compatible API. The platform team sets routing, fallbacks, guardrails, budgets and rate limits in one place. The TrueFoundry MCP Gateway does the same for the tools agents call: access control and guardrails.
Because every request passes through it, the gateway knows things no single app does:
- which team sent a request
- which model served it
- whether a guardrail stepped in or a budget blocked it
- what it cost
TrueFoundry's guide to AI gateway observability covers these signals in more depth.
What Oodle adds
Oodle is observability built for agents. Next to metrics, logs, traces, APM, real user monitoring and infrastructure monitoring, it has Agent Observability: traces, evaluations, prompt management and automated insights. TrueFoundry runs alerting for its own gateway and platform on Oodle.
Oodle is built on OpenTelemetry, the open source standard for traces, metrics and logs. The gateway can label its spans with OpenTelemetry's semantic conventions for generative AI, the standard names for model calls, so Oodle recognizes them as GenAI traces.
Oodle also keeps every trace by default instead of sampling. The one request a user complains about is still there when you go looking for it. (More on why in You can't sample your way to reliable agents.)
Why trace at the gateway, not in each app
Most AI observability starts inside the application. Each team adds an SDK, and coverage depends on who remembered to.
Tracing at the gateway works differently. The gateway records every model call as a standard OpenTelemetry trace, so one export setting covers every app and agent that calls a model through TrueFoundry, including the ones nobody instrumented. It also captures events only the gateway sees, such as a fallback from one provider to another, or a request blocked by a budget or rate limit.
Here is how the work splits between the two:
| Area | TrueFoundry AI Gateway | Oodle |
|---|---|---|
| Each request | Records a timed span for each guardrail check, the model call and the provider call | Shows the request as a GenAI trace with model, latency and cost, plus the prompt and response |
| Cost | Calculates the cost of every request | Prices each call from model rates set in Oodle and breaks down spend for chargeback |
| Limits and alerts | Enforces budgets and rate limits and records each block | Runs monitors with runbooks and routes alerts to on-call tools |
| Quality | Applies guardrails and records each result | Scores traffic with LLM-as-judge evaluators and turns failing traces into test datasets |
| Agent access | Lists the Oodle MCP server and controls who can call which of its tools | Answers agents' queries about logs, metrics, traces and alerts |
| Setup and data | An admin turns on export once, and TrueFoundry keeps its own copy | Keeps every trace by default instead of sampling |
How the integration works
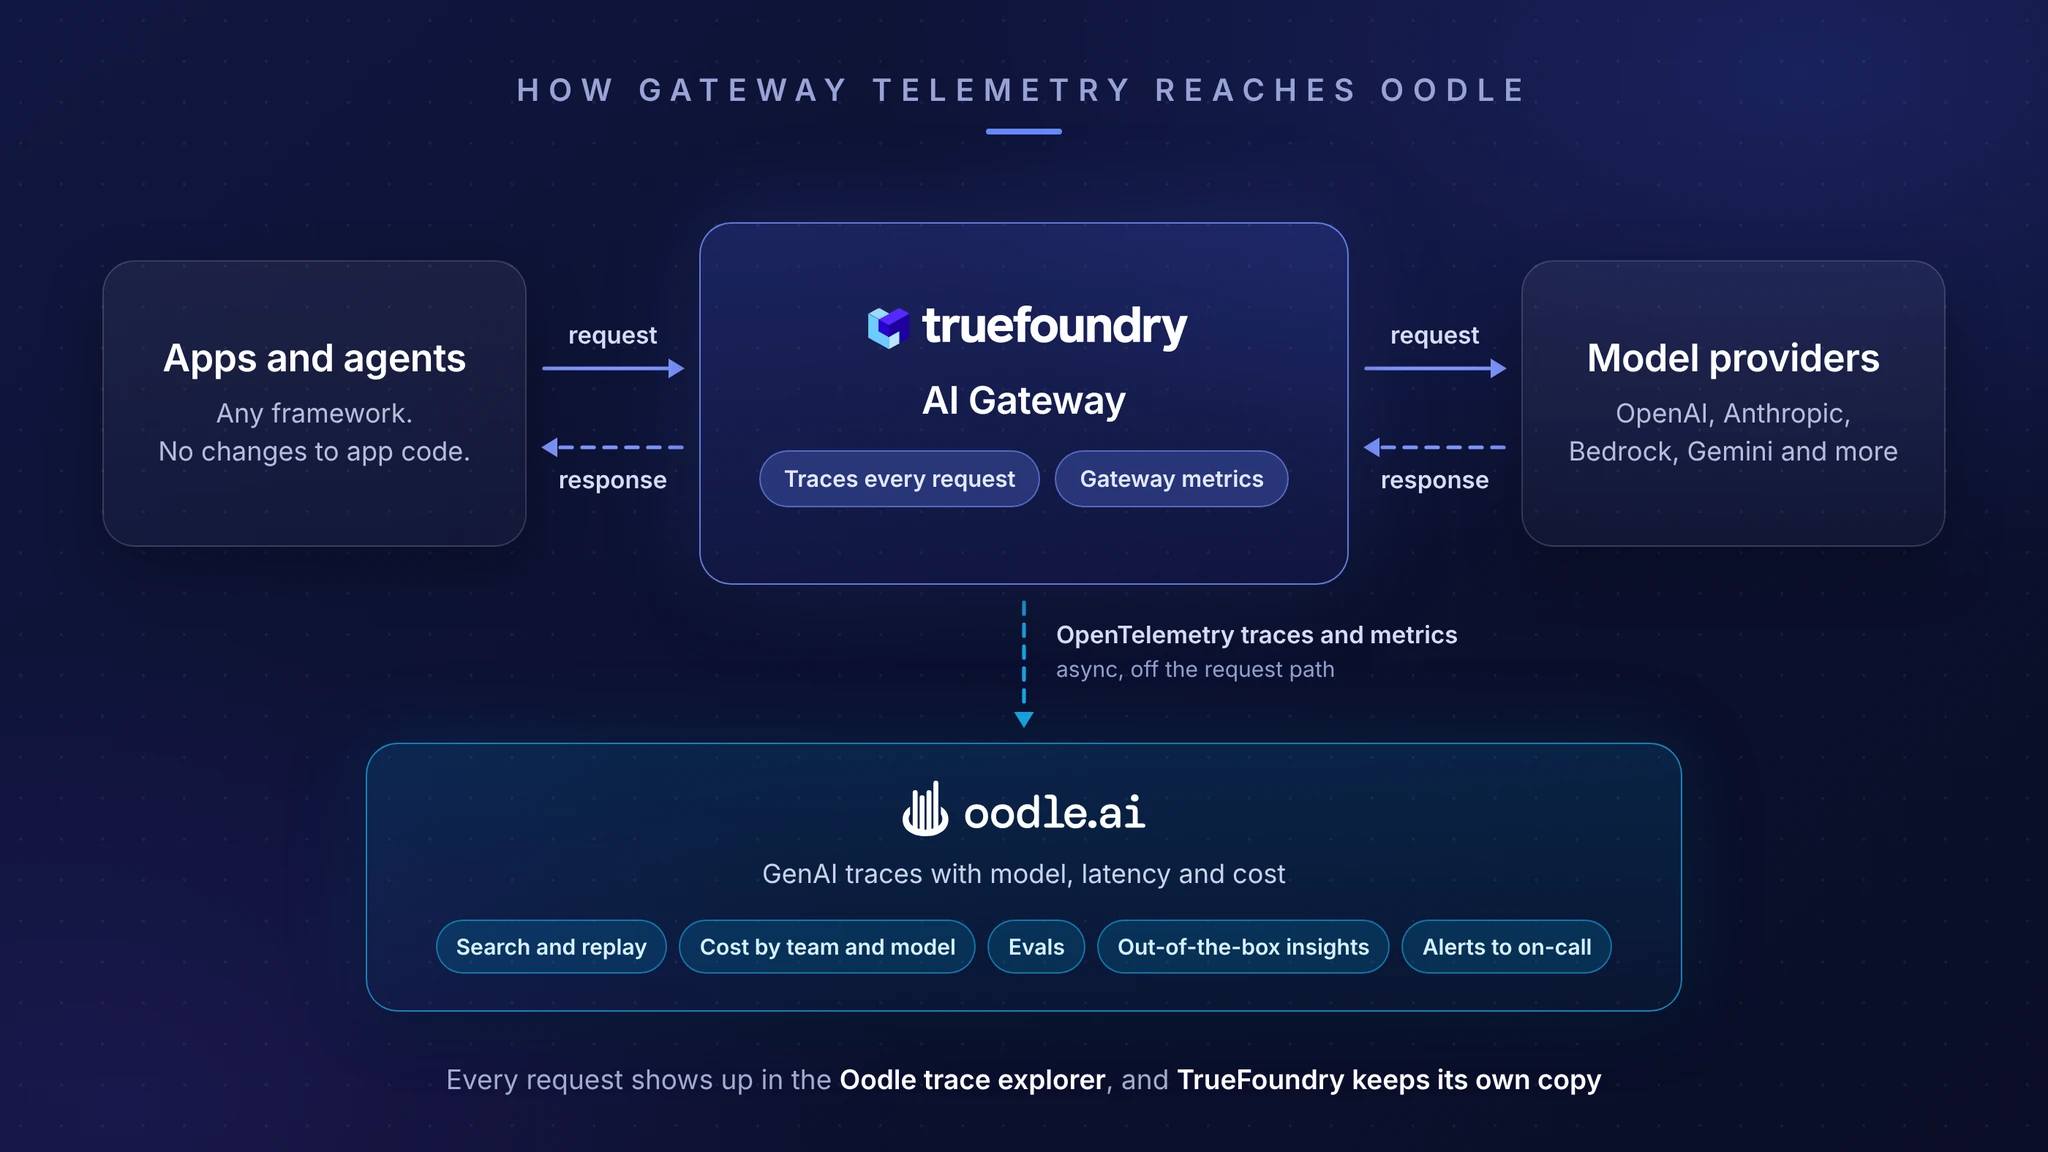
- An app or agent sends its request to the TrueFoundry AI Gateway, exactly as it does today.
- The gateway applies your policies, calls the model and records each step as an OpenTelemetry trace, along with gateway metrics.
- The gateway sends a copy to Oodle asynchronously, off the request path, so a slow or unreachable Oodle can't hold up a model call. TrueFoundry keeps its own copy, so its dashboards don't change.
- In Oodle, teams search and replay requests, track cost and latency, run evaluations and set alerts.
- Optionally, agents query Oodle back through the Oodle MCP server in the MCP Gateway.
Gateway traces cover every model call. For full agent sessions, per-user views and agent graphs, also add OpenTelemetry to the app itself. When the app passes its trace context along, the gateway continues the same trace, and the app's spans line up with the gateway's in Oodle.
How to set it up
TrueFoundry's Oodle setup guide and Oodle's TrueFoundry guide have the details for each step.
- In Oodle, open the TrueFoundry tile on the Integrations page. It lists the connection details for your Oodle account.
- In TrueFoundry, open the AI Gateway settings, turn on trace export and enter those details.
- If you want gateway metrics in Oodle as well, turn on metrics export the same way.
- Save, send a few requests through the gateway, and check that they appear in Oodle's trace explorer.
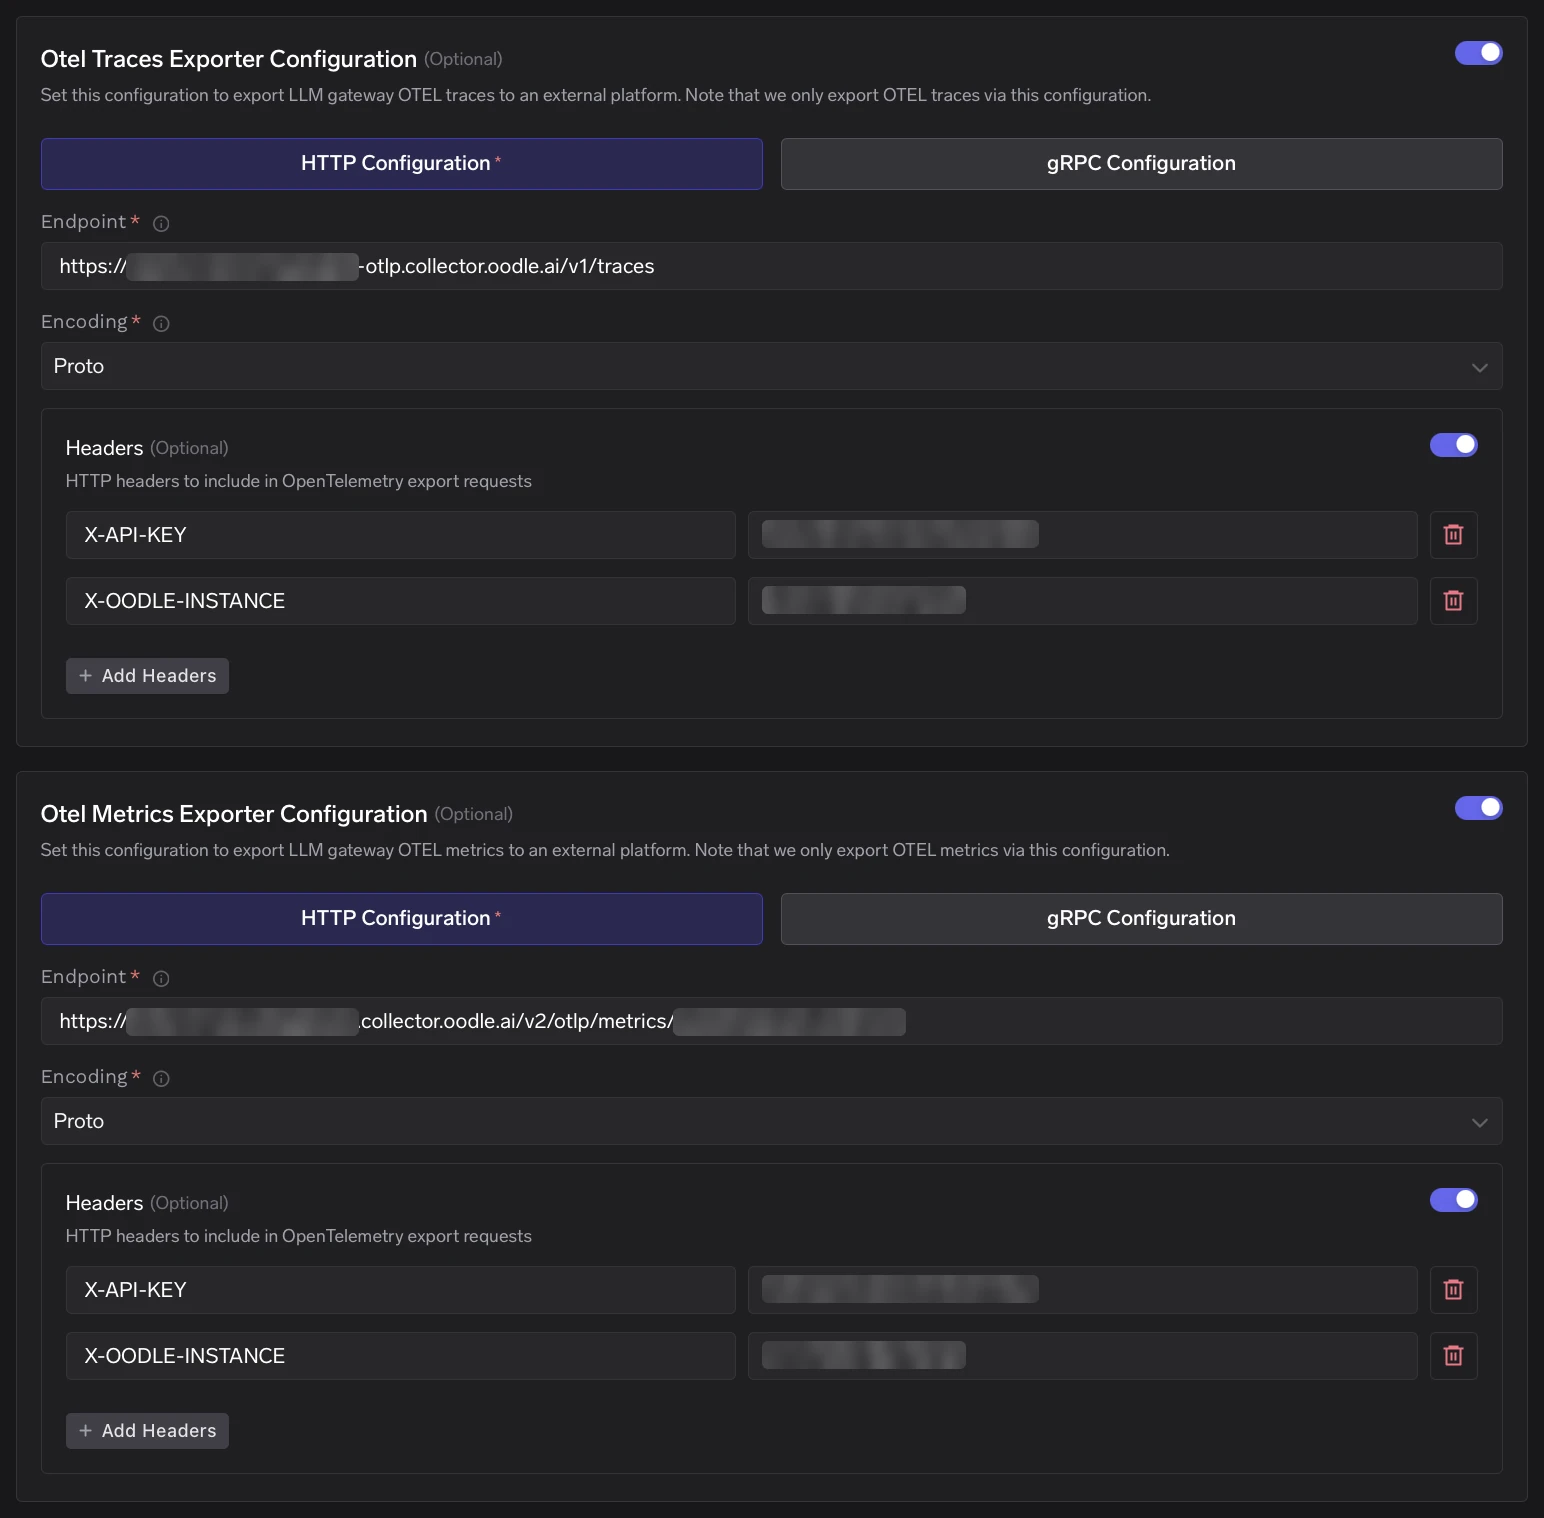
In hybrid and self-hosted deployments, the gateway running in your own cluster sends the traces to Oodle itself, and the setup guide covers that path.
What you can do with gateway traces in Oodle
Debug a slow or wrong answer
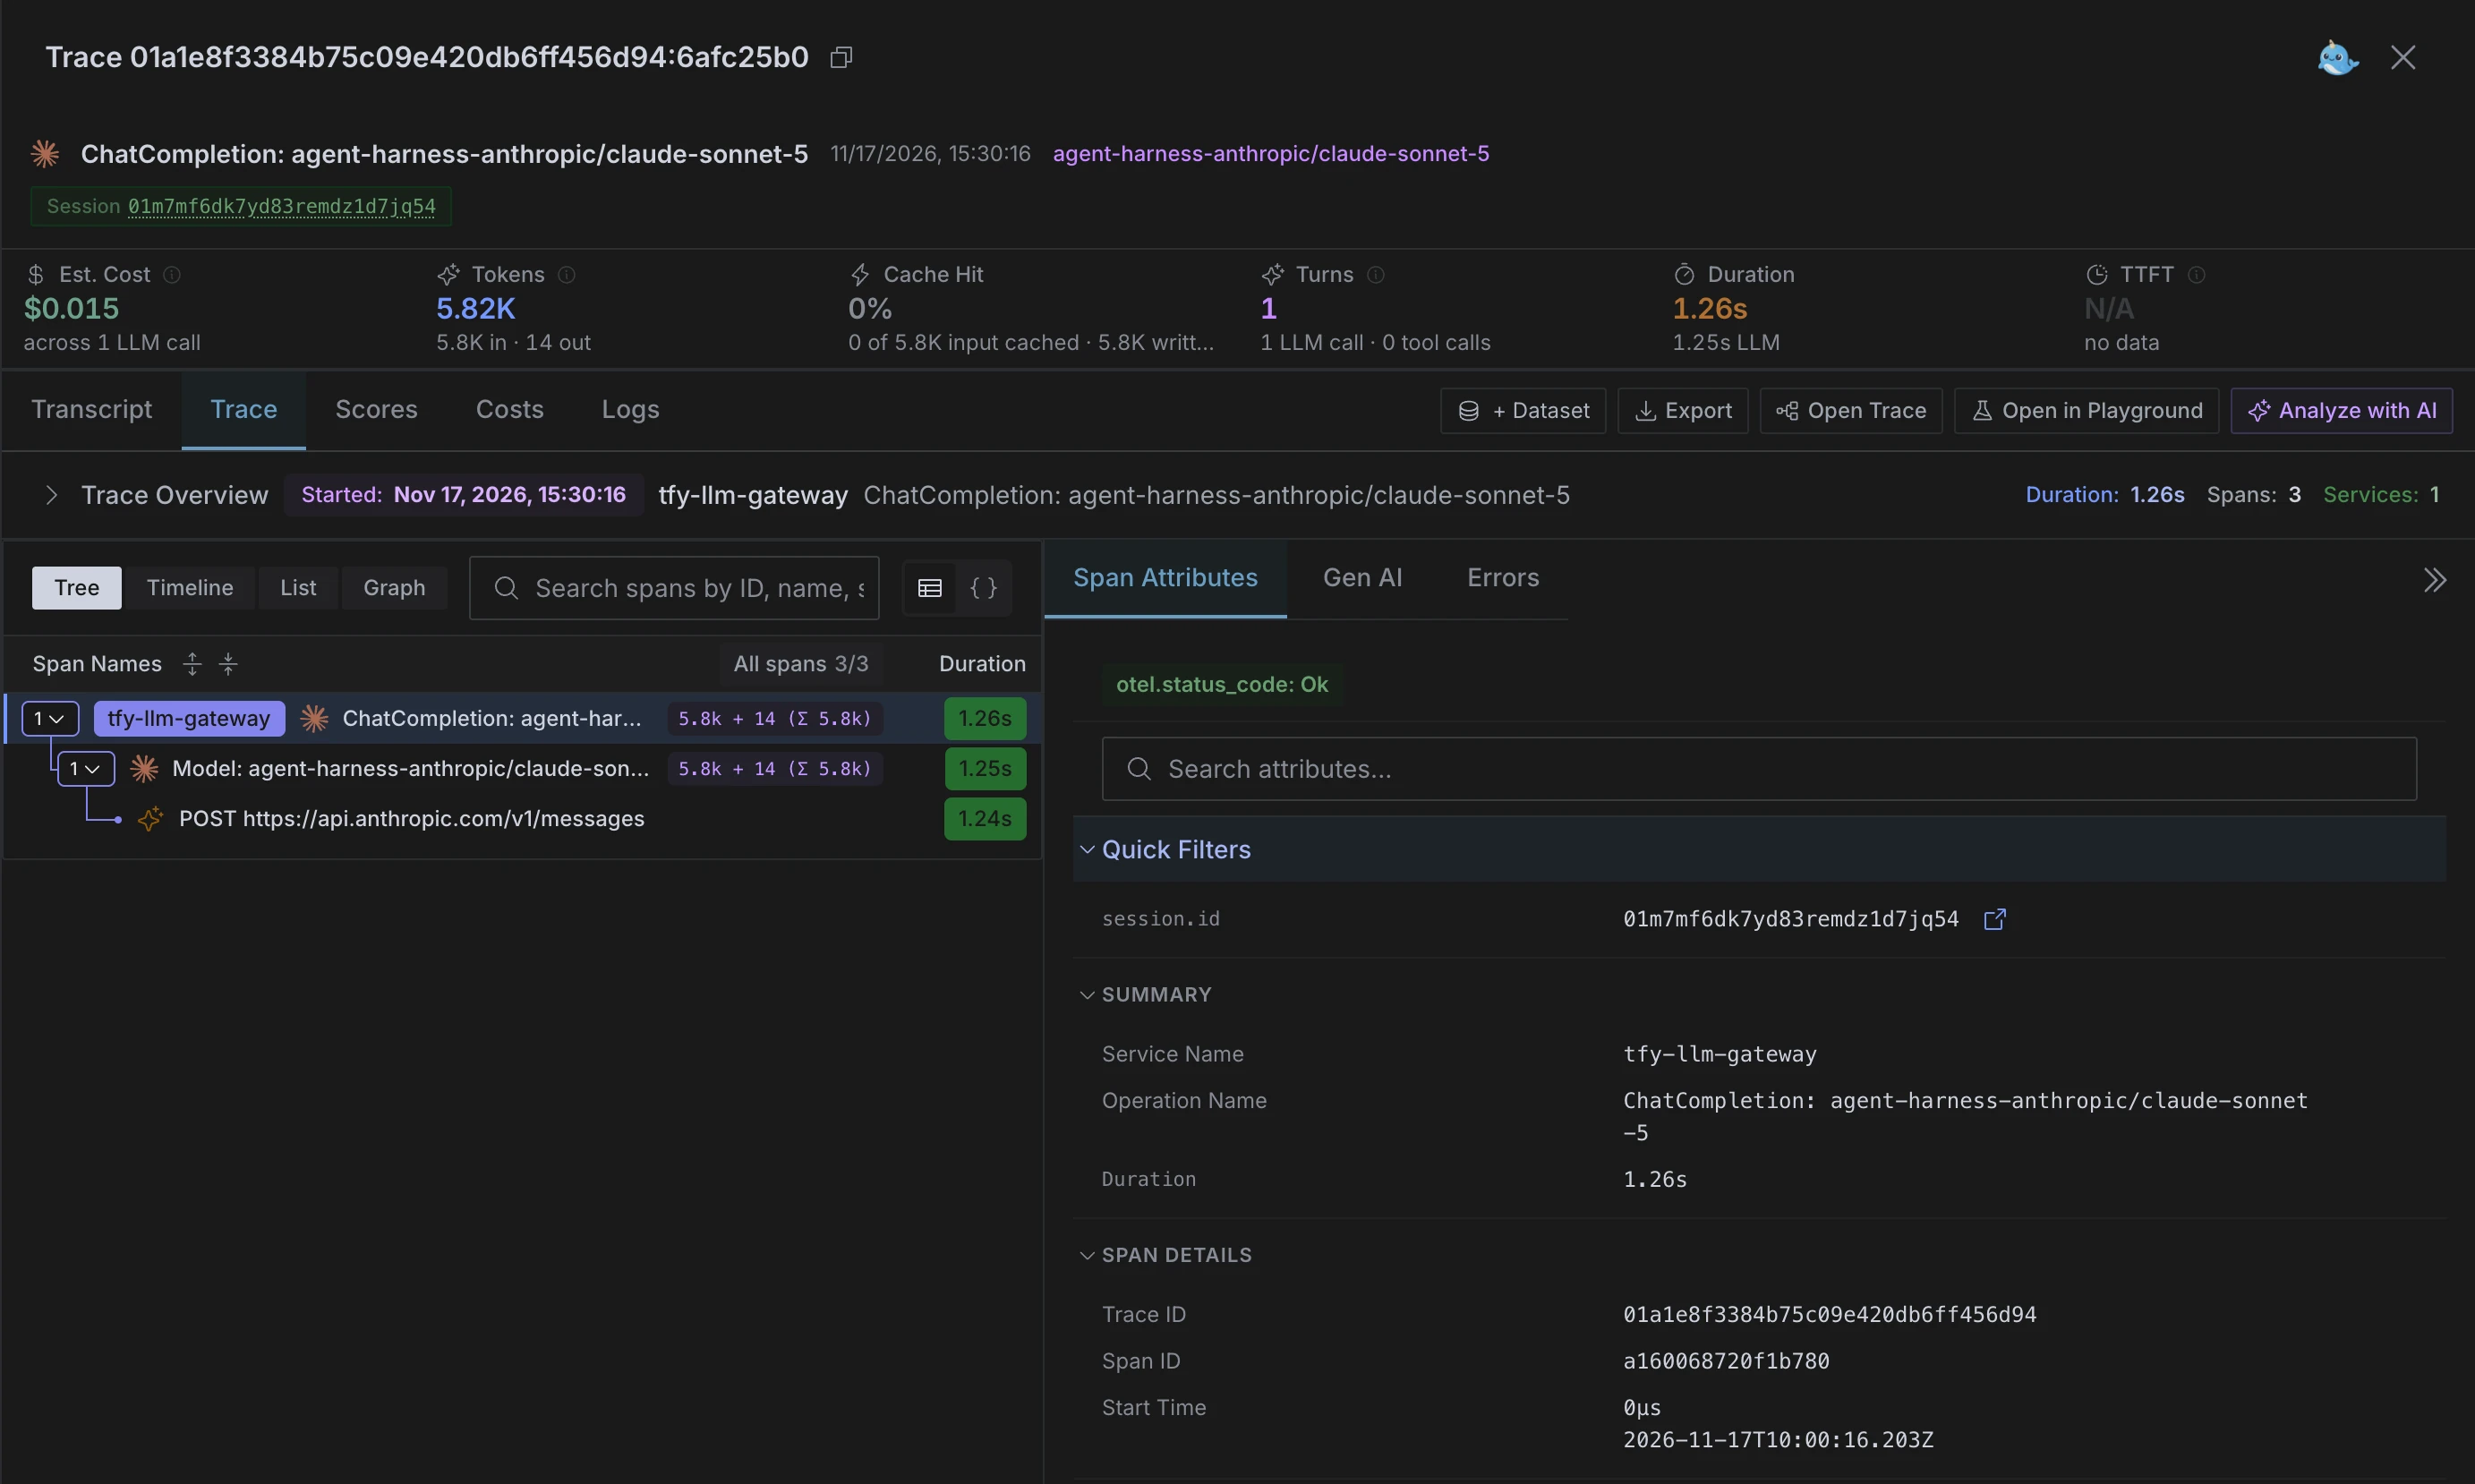
When someone reports a bad answer, find the exact request behind it. Search on user, team, error type, guardrail result, request metadata, or text in the prompt or response. A gateway trace in Oodle contains:
- the model that served the request, with its latency and cost
- a timed span for each step: the incoming request, each guardrail check, the model call and the provider call
- the result of each guardrail check and any error
- the user, team and other metadata attached to the request
- the prompt and the response
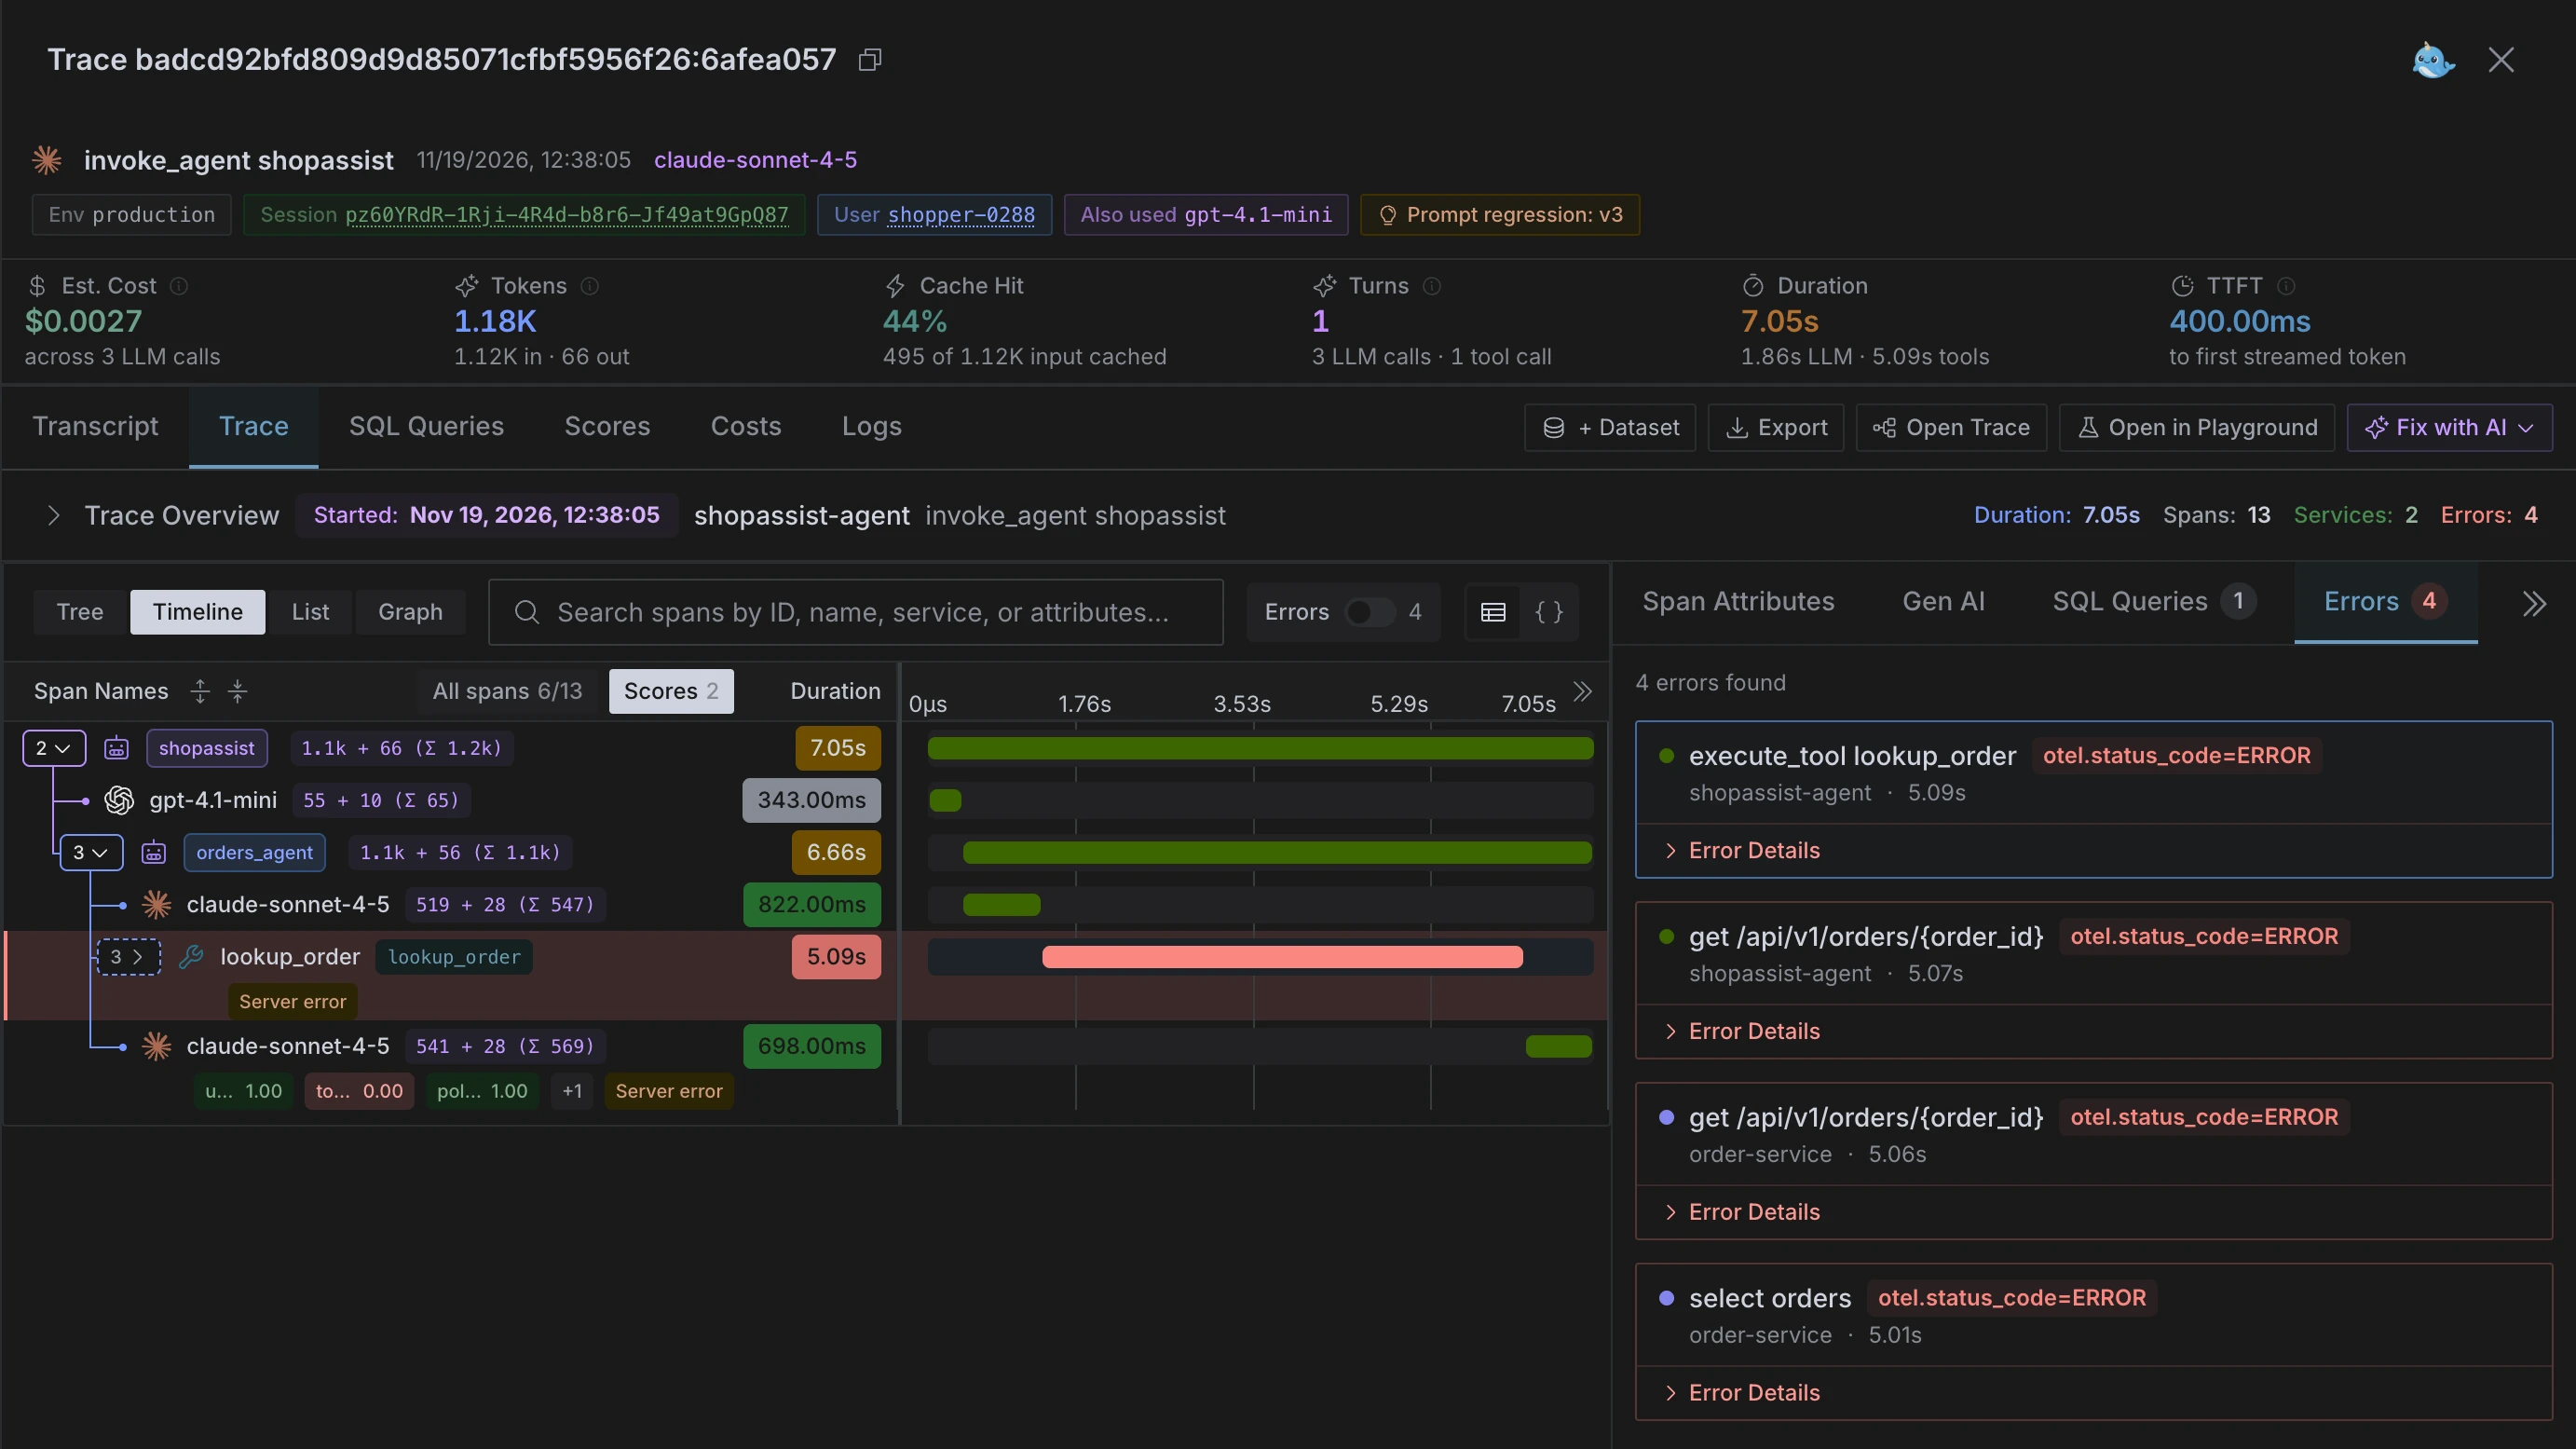
We checked the first two on gateway traffic in a test environment. If a fallback kicked in, Oodle shows each attempt as its own span under the same request. You can then open the trace in Oodle's playground to replay the conversation and test a fix.
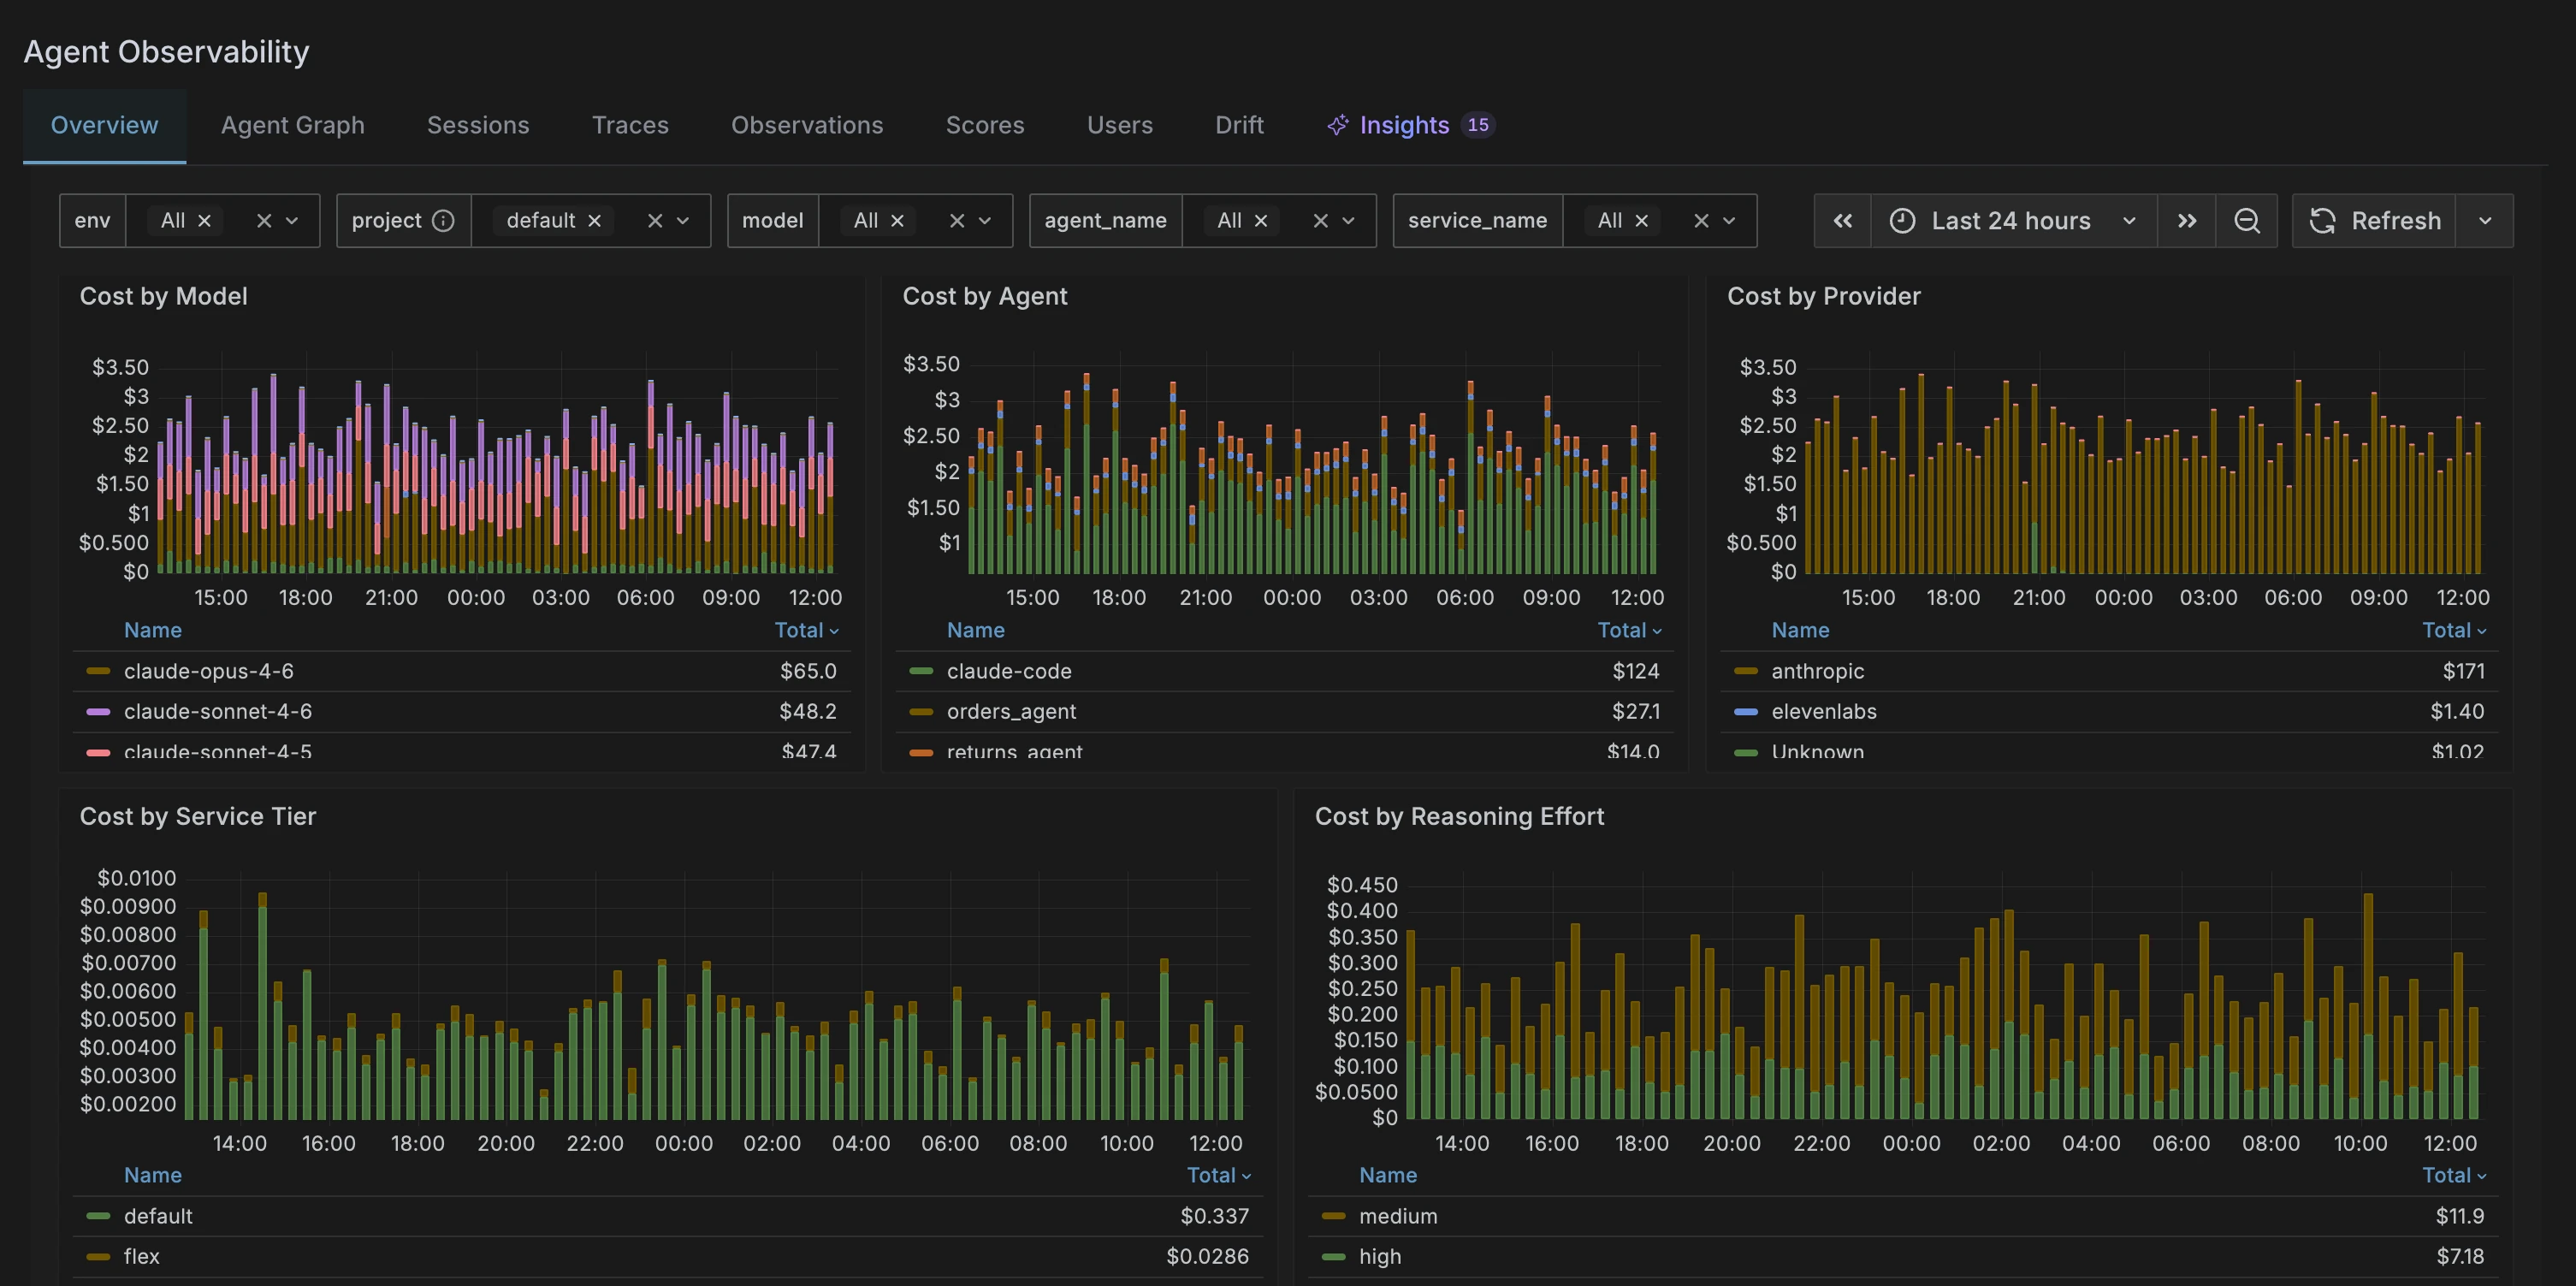
Track LLM cost by team, user and model
In our tests, Oodle's per-request cost matched the gateway's own. On one test request, Oodle showed $0.030 and the gateway $0.029958: the same amount, rounded to a tenth of a cent.
Oodle prices each call from the model rates you set in Oodle, so keep those in line with your provider's pricing. From there you can split spend by model, team, user or any metadata label for chargeback, and get an alert when spending climbs. For the finance side, see TrueFoundry's guide to LLM cost tracking and Oodle's AI cost management.
Watch latency, errors and rate limits
In our tests, these gateway metrics arrived in Oodle next to the traces:
- requests, HTTP status codes and cost
- latency, time to first token and the time between tokens
- budget and rate-limit checks, and the requests they blocked
- MCP request counts and latency
Oodle monitors can alert on any of these and send the alert, with a runbook attached, to the chat and on-call tools your team already uses.
Check answer quality on real traffic
Oodle can flag behavior as traces arrive, such as a refusal, or a user asking the same thing again without getting an answer. You can describe your own signal in plain English. It also runs LLM-as-judge evaluators for issues like hallucination and toxicity.
You can add failing traces to a dataset and test a new prompt or model against those real cases before it ships. We haven't tested these features on gateway traffic yet, so Oodle's docs are the reference for how they behave there.
Let agents query Oodle through the MCP Gateway
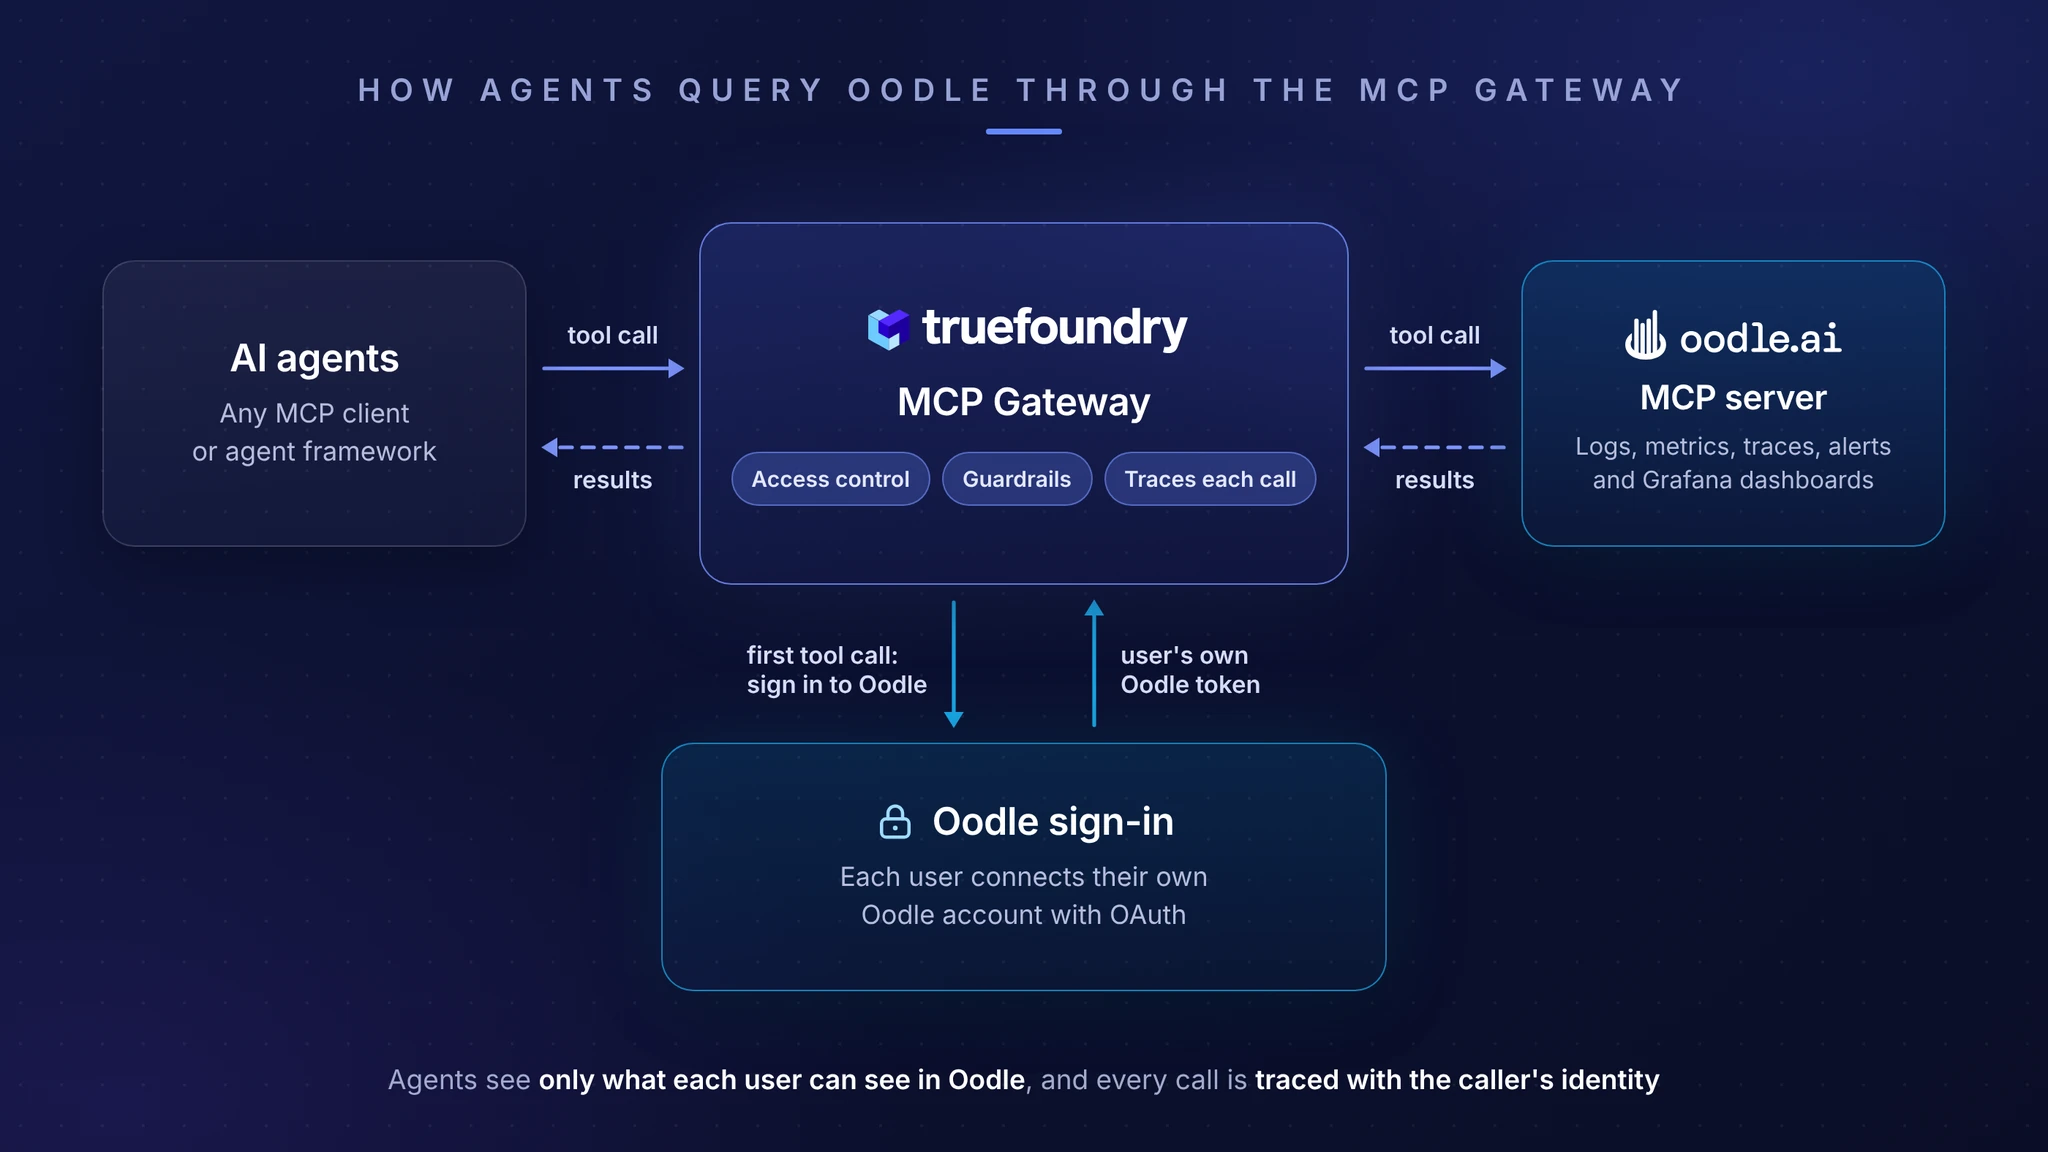
The Oodle MCP server is one of the official remote MCP servers in TrueFoundry's MCP Gateway. Agents behind the gateway can use it to query logs, metrics, traces and alerts in Oodle. An on-call agent, for example, can list active alerts and pull the traces behind them.
With OAuth sign-in, each user connects their own Oodle account, so an agent sees only what that person can see in Oodle. An Oodle API key works too. The gateway decides who can use which Oodle tools, applies guardrails to those calls, and traces each one with the caller's identity.
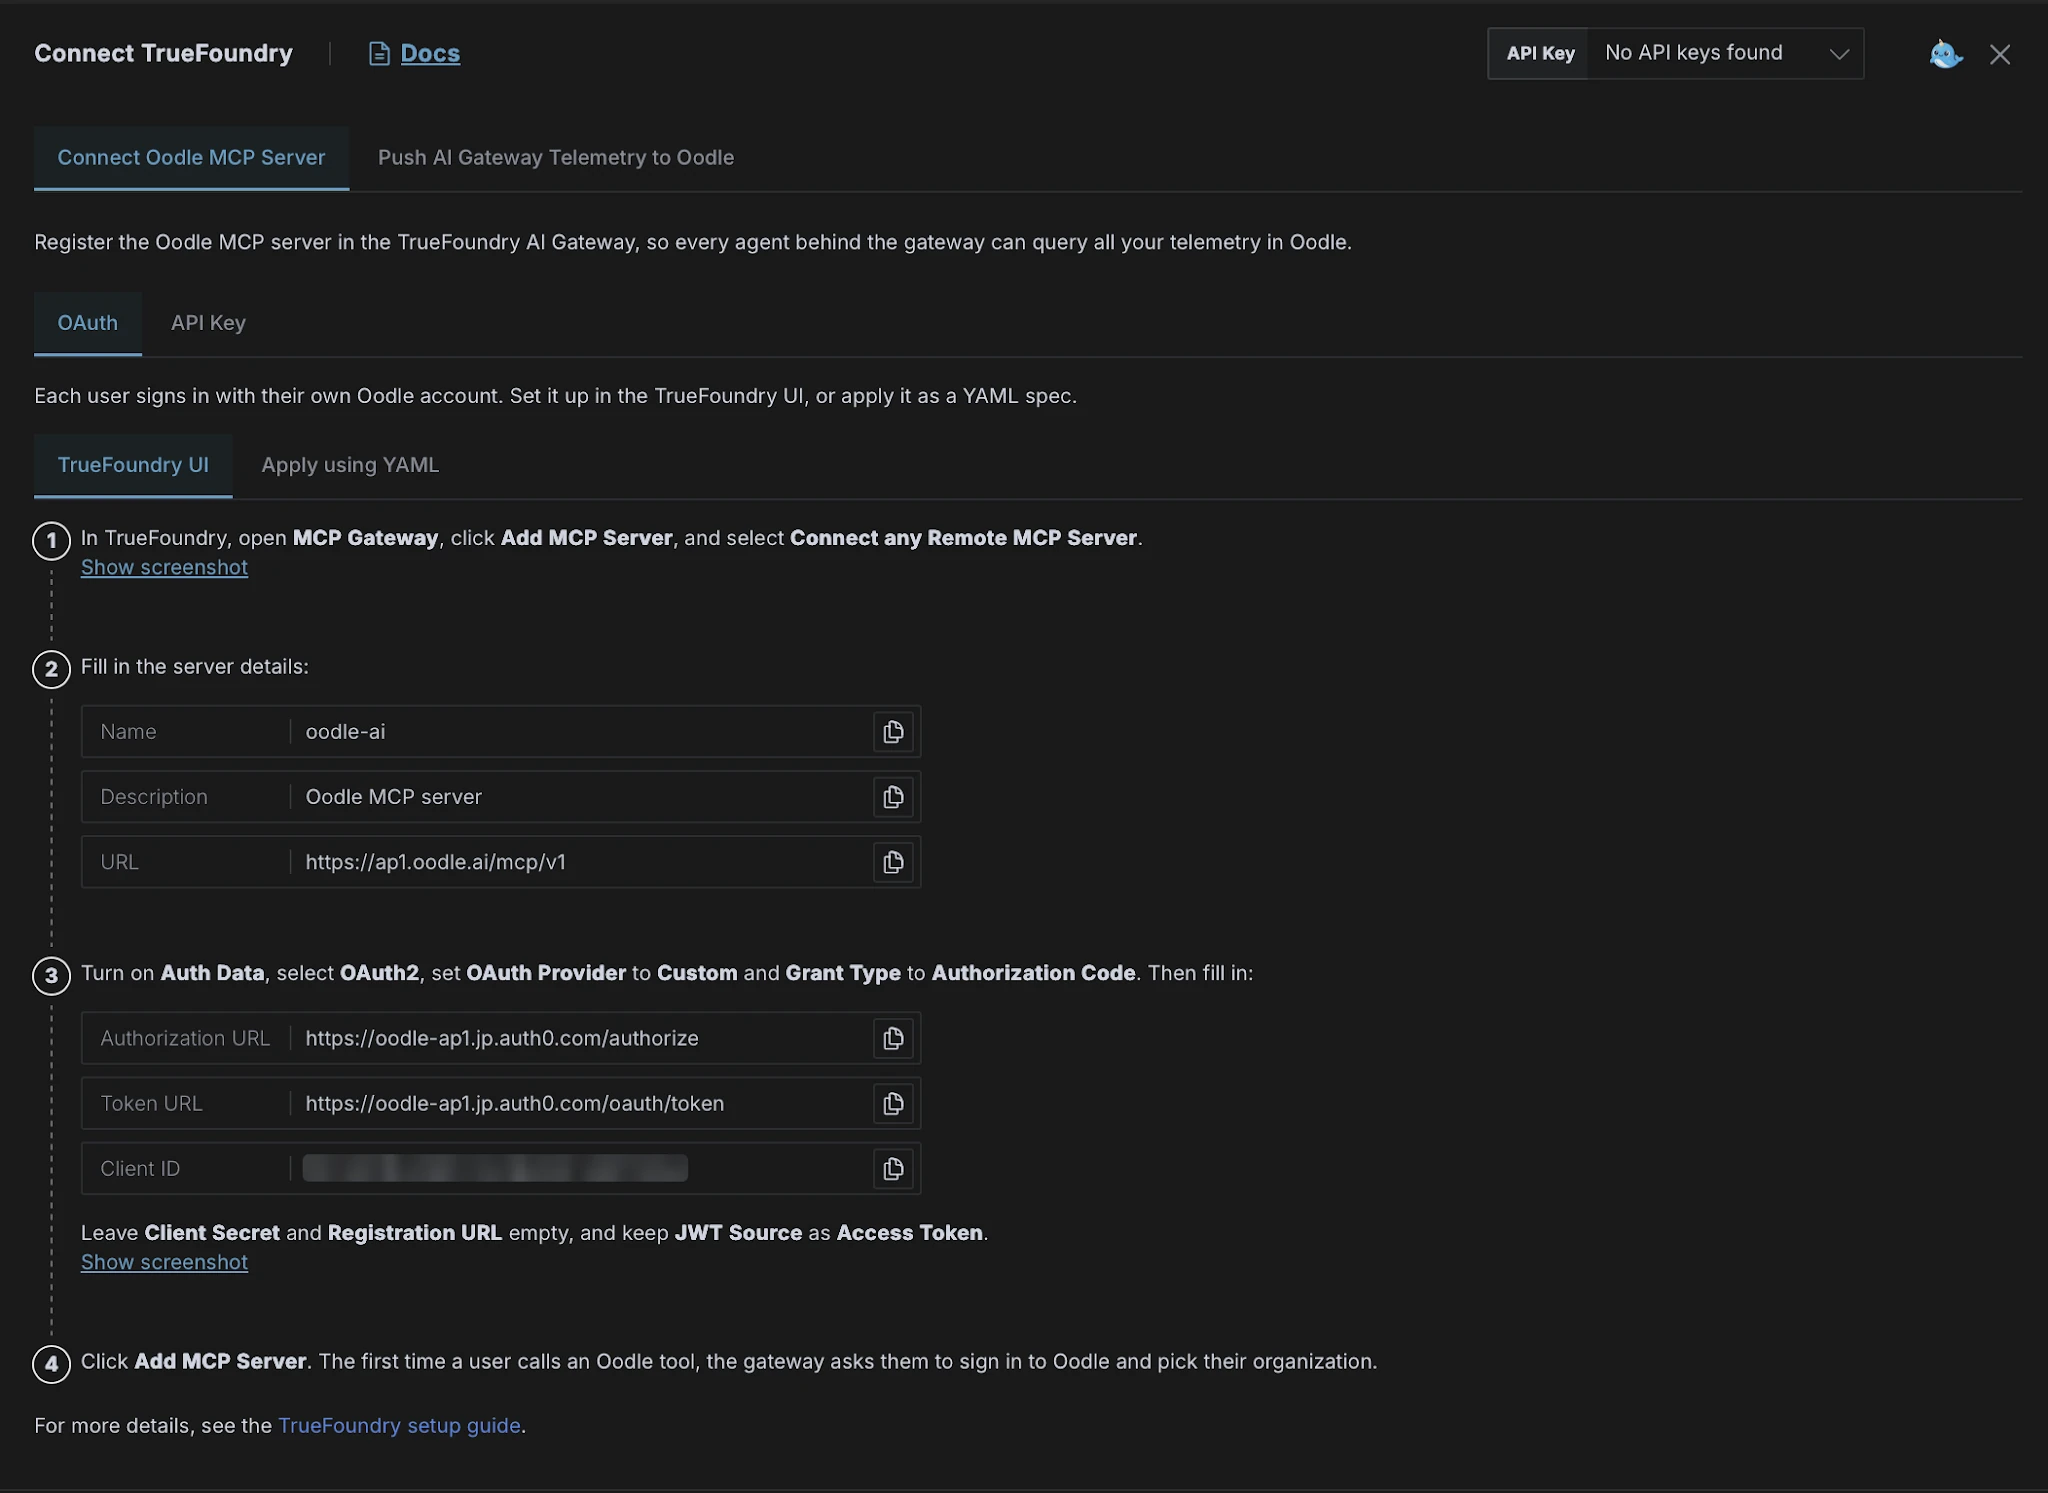
Next steps and related reading
Turning on this integration is a one-time change in the gateway settings, with no application code. From then on, every model call through the gateway reaches Oodle as a trace with its cost attached. Engineers can debug it, and finance can report on it.
To get started:
- Set it up: follow TrueFoundry's Oodle setup guide or Oodle's TrueFoundry guide.
- No Oodle account yet? Start free at oodle.ai.
- See it on your own traffic: book a demo with TrueFoundry, or explore the TrueFoundry AI Gateway.
Related reading:
- What is agent observability?: what Oodle's Agent Observability does and the silent agent failures it catches
- What is LLM observability?: the signals to track for model calls
- OpenTelemetry for LLMs: how TrueFoundry instruments a multi-provider AI gateway: span design, cost attribution and async export
Frequently asked questions
What is the Oodle integration with TrueFoundry AI Gateway?
It connects the two products in two ways, and each works on its own. The gateway exports OpenTelemetry traces and metrics for every request to Oodle, where teams debug calls and track cost. Separately, Oodle's MCP server is available in TrueFoundry's MCP Gateway, so agents can query Oodle under the gateway's access controls.
What's the difference between LLM observability and agent observability?
LLM observability tracks single model calls: the prompt, the response, latency, errors and cost. That is enough to debug one slow or wrong answer. Agent observability follows a whole agent run across many model and tool calls, to explain why the agent did what it did. Gateway export covers every model call, and instrumenting the agent itself joins those calls into full agent traces in Oodle.
What latency does the TrueFoundry AI Gateway add?
Very little. The gateway adds under 3 ms of internal latency, and in TrueFoundry's published benchmark, run on a machine with 1 vCPU and 1 GB of memory, it handled 350+ requests per second. Export to Oodle runs off the request path, so an Oodle outage can't block a model call.
Does TrueFoundry support MCP and AI agents?
Yes. The MCP Gateway sits in front of the MCP servers your agents use, including Oodle's. It controls who can call which tool, applies guardrails to those calls, and traces each call with the caller's identity. Gateway metrics in Oodle include MCP request counts and latency, so tool traffic shows up next to model traffic.
Does TrueFoundry work with my existing observability stack?
Yes. The gateway exports standard OpenTelemetry traces and metrics, so it works with Oodle and with other OpenTelemetry-compatible backends. TrueFoundry's export docs explain how to connect them.