Blog
Engineering deep dives and customer stories from the people building Oodle.
Latest
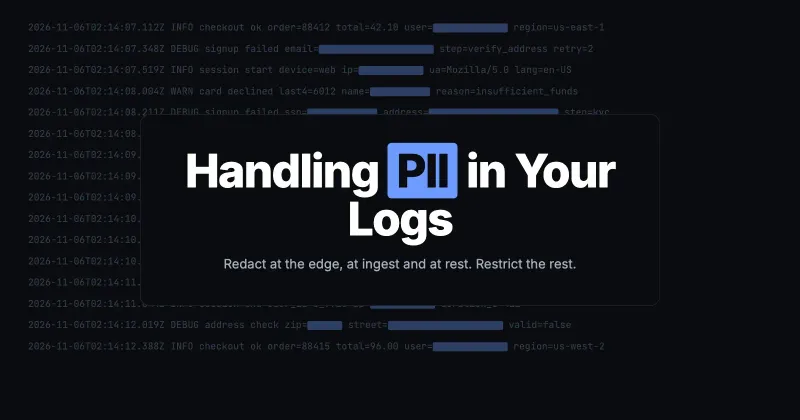
Handling PII in Your Logs
Where PII can be handled in a log pipeline (client side, at ingest, in storage), what you can do with it, and how Oodle helps at each step.
 Akhilesh Krishnan
Guides
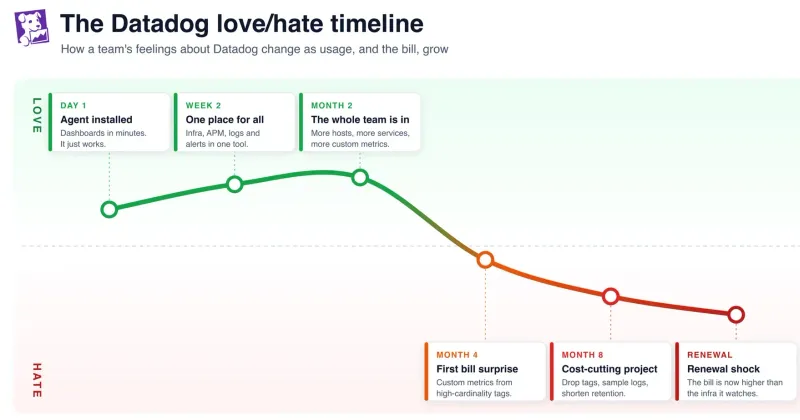
A Platform Engineer's guide for Datadog migration
How to plan a Datadog migration: map your signals, decide what replaces the Datadog agent, avoid PromQL query translation traps, and keep APM working.
 Gaurav Maheshwari
AI
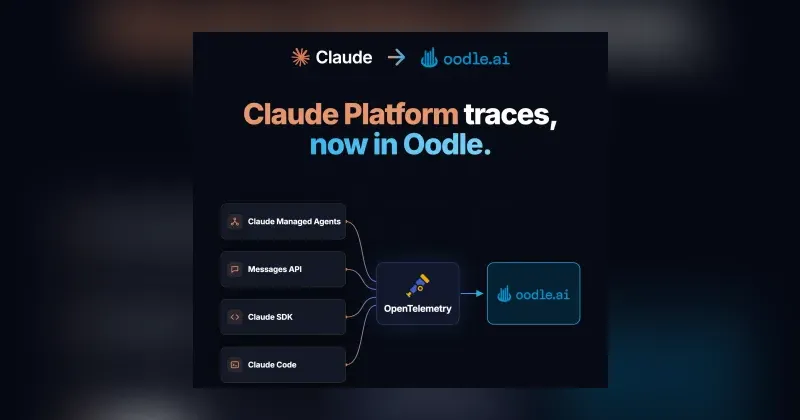
OpenTelemetry traces on Claude Platform: why it matters
Claude Managed Agents, the Messages API, and Claude SDKs now export OpenTelemetry traces. What that changes for your agents, and how to see the traces in Oodle.
 Anirud Samala

Engineering
How Going Back to the Stone Age Can Cut AI Costs
I taught my AI sub-agents to talk like cavemen. Alert investigations got 23% cheaper, 20% faster with no impact on quality
 Vijay Karthik
AI
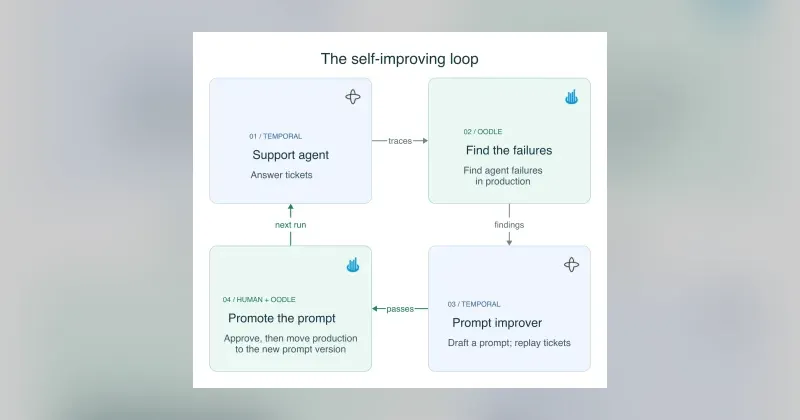
Building Self-Improving Agent Loops with Temporal and Oodle
Build a self-improving AI agent loop with Temporal and Oodle: durable agent workflows, agent traces and evals, and new prompts tested on a dataset first.
Gaurav Maheshwari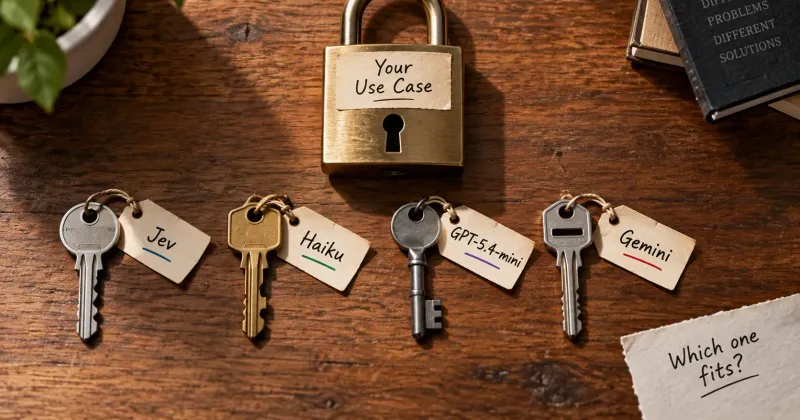
AI
Is Jev the right model for your agents? A hands-on comparison with Haiku 4.5, GPT-5.4-mini, and Gemini 3.5 Flash
Jev vs Claude Haiku 4.5, GPT-5.4-mini, and Gemini 3.5 Flash on support escalation and model routing: accuracy, cost, latency, and why Jev's threshold matters.
Akhilesh Krishnan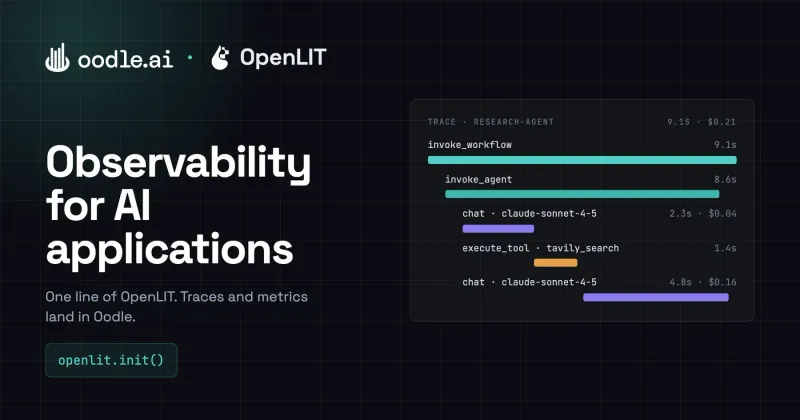
AI
Observability for AI Applications Using Oodle and OpenLIT
Instrument LLM apps and agents with OpenLIT in one line, send OpenTelemetry gen_ai traces and metrics to Oodle, and track cost, latency, and tool loops.
Anirud Samala
Engineering
Someone's Hack is Someone Else's Bug
Why cmdk command palettes jump in Safari: WebKit fires fake mousemove events on keyboard scrolling, a 2010 hack that the W3C pointer events spec rules out.
 Sujeet Gholap
Engineering
AI Sensei, Make My Code Go Brrrrr!
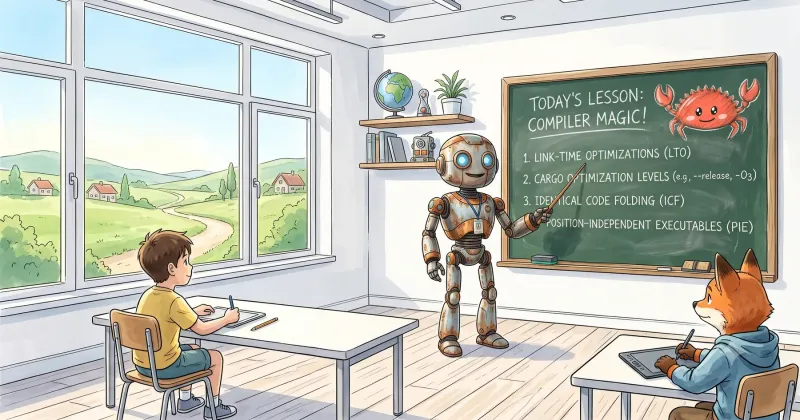
How AI helped cut AWS Lambda cold starts for a Rust DataFusion binary by about 300 ms, with zip size benchmarks, opt-level=z, LTO, and why UPX made it worse.
Sujeet Gholap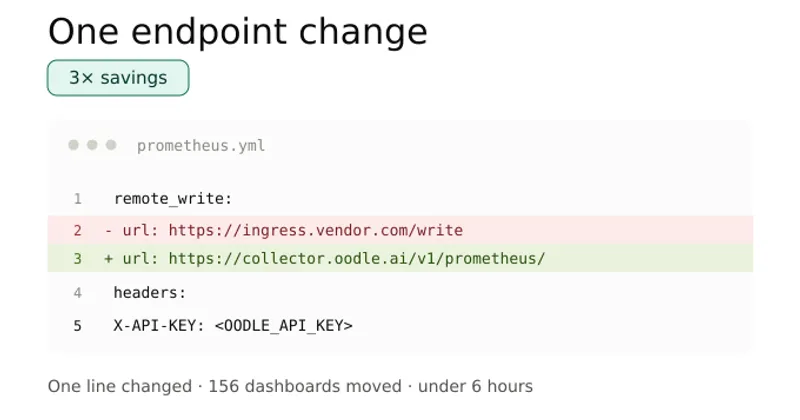
Case Studies
One Endpoint Change: CureFit's 3× Savings with Oodle
CureFit moved its Prometheus metrics to Oodle in under 6 hours by changing one remote_write endpoint, kept all 156 Grafana dashboards, and cut metrics cost 3x.
Akhilesh Krishnan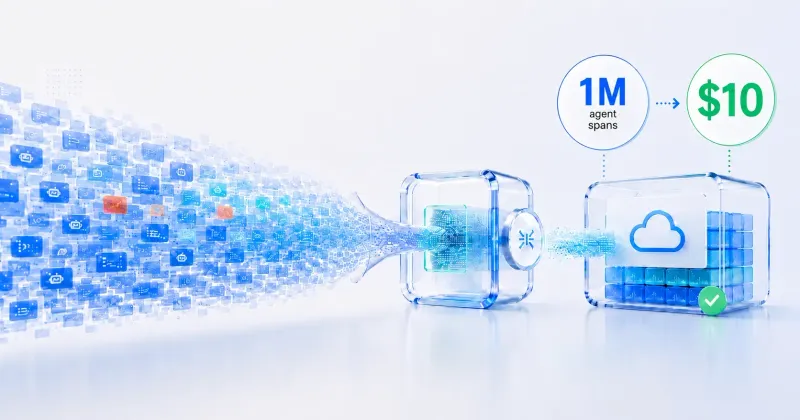
AI
How We Made It Possible to Analyze Every AI Agent Span
How we made 7-day AI agent trace queries 30x faster, from 60s to under 2s, by changing how Oodle stores large prompts: out-of-band dictionaries, lazy loading.
Vijay Karthik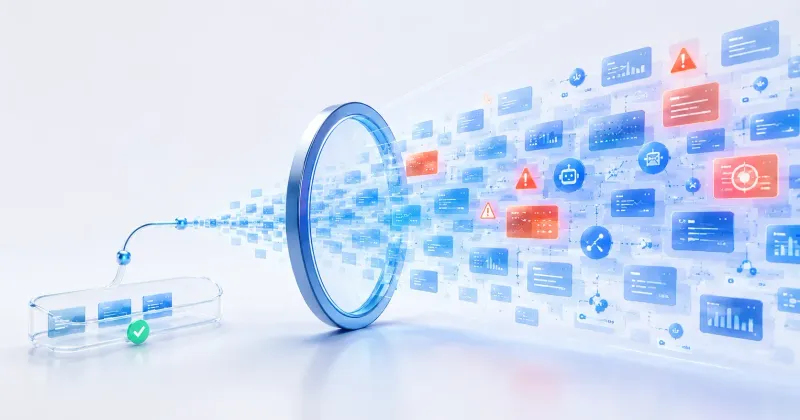
AI
You Can't Sample Your Way to Reliable Agents
Sampling 1% of agent traces for LLM-as-a-judge evals misses rare failures. How Oodle checks every trace with sentiment, anomaly detection, and code evaluators.
Vijay Karthik
Case Studies
How Lookout broke free from 8 years of lock-in to AI-Native Observability in 6 weeks
After 8 years on one observability platform, Lookout moved several thousand nodes, 300+ dashboards, and 2,000 alerts to Oodle in 6 weeks, at 5x lower cost.
Akhilesh Krishnan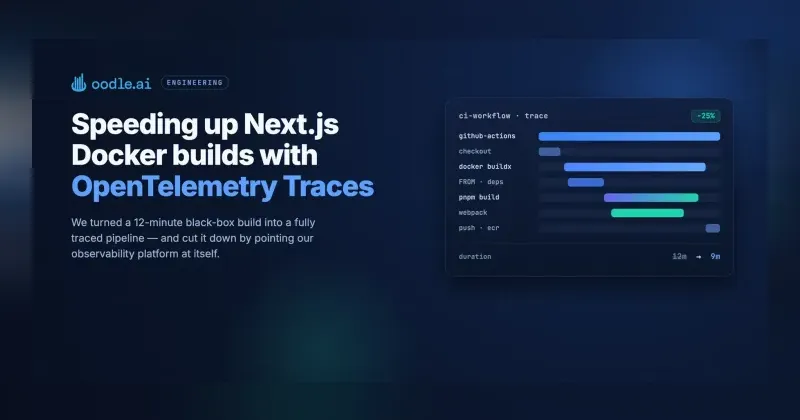
Engineering
Speeding up Next.js Docker builds with OpenTelemetry Traces
We cut our Next.js Docker build from 12 to 9 minutes by tracing GitHub Actions, BuildKit, and next build with OpenTelemetry, then fixing webpack bottlenecks.
Anirud Samala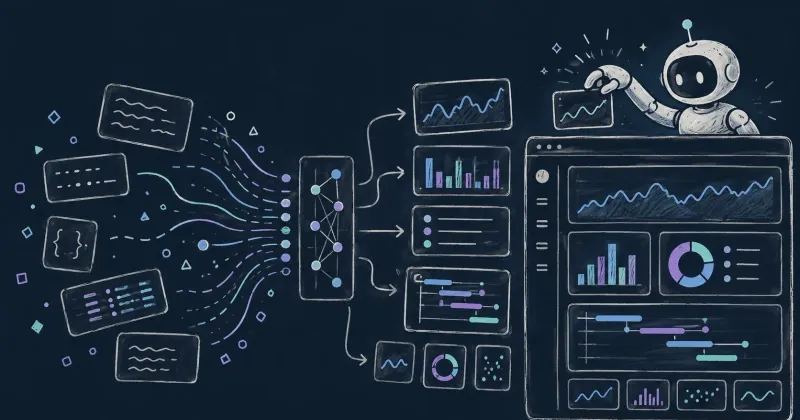
Engineering
How we taught our AI to draw
We tried making our AI write JSON to render UI components. It worked, until OpenUI showed us the better interface was declarative text.
Gaurav Maheshwari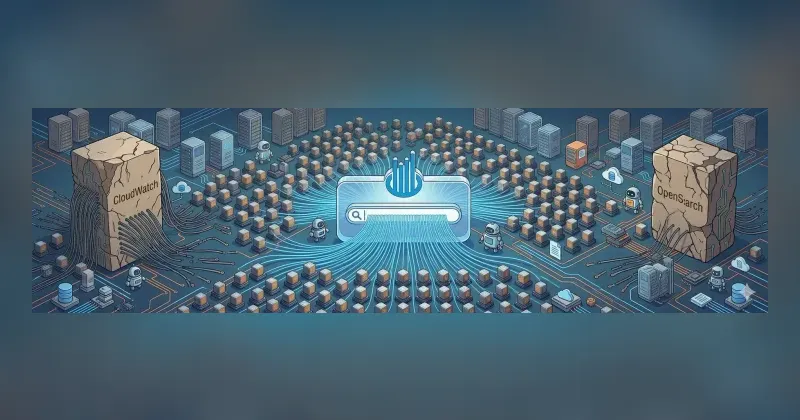
Case Studies
200 Services, One Search Bar. How Zaggle Replaced CloudWatch and OpenSearch
Zaggle replaced CloudWatch and OpenSearch with Oodle for 200+ services, with no app code changes. Searches take seconds, not minutes, and support self-serves.
Akhilesh Krishnan
Engineering
Et tu, D2?
The same D2 file can render different diagrams depending on CLI flags like --layout elk. A shebang line makes the .d2 file self-describing and reproducible.
Sujeet Gholap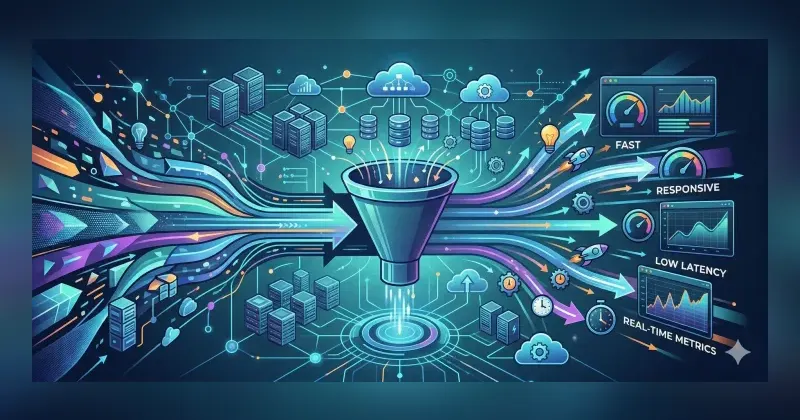
Engineering
How Oodle Keeps Observability Fast at Scale
How Oodle keeps metrics queries fast at scale: durable S3 storage, AWS Lambda fan-out for bursty queries, compaction, and a columnar PromQL engine.
Vijay Karthik
News
Auth0 to Logs Hero
Send Auth0 logs to Oodle with custom log streams, turn cryptic event codes like fi and flo into readable text with lookup tables, and query nested fields.
Sujeet Gholap
Case Studies
How Labra engineers stopped getting logged out mid-debug
Labra replaced New Relic and duplicate CloudWatch logging with Oodle across AWS, Azure, and GCP: no per-user seats, OpenTelemetry traces, and AI-built alerts.
Sujeet Gholap
News
Supabase + Oodle: Because database logs deserve love too
Supabase now supports log drains, and Oodle has a native Supabase integration. Send your Supabase logs to Oodle and search them next to the rest of your logs.
Sujeet Gholap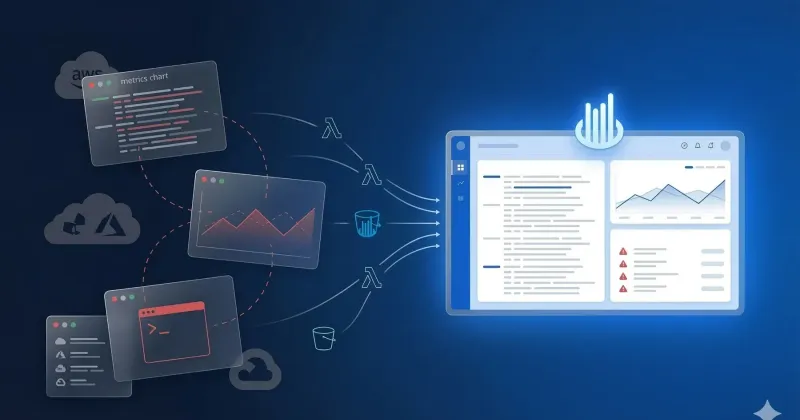
Case Studies
One Tool, One Workflow, Everyone on the Same Page - Bedrock Data's Observability Reset with Oodle
Bedrock Data swapped a log vendor, CloudWatch, and scripts for Oodle in under five hours, linked Lambda logs to metrics, and halved incident resolution time.
Akhilesh Krishnan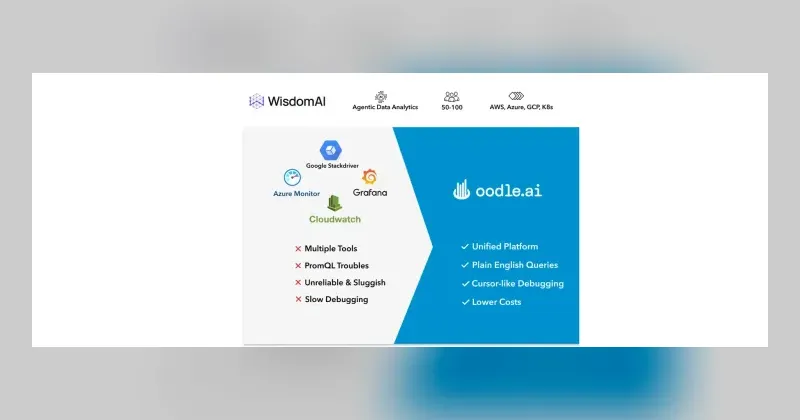
Case Studies
Three Clouds, One AI Assistant: How Wisdom AI Unified Observability on Oodle
Wisdom AI moved from CloudWatch, GCP Cloud Logging, Azure Monitor, and self-hosted Grafana to Oodle: one view of three clouds at 3x less than CloudWatch.
Gaurav Maheshwari
Partnerships
Bindplane + Oodle.ai: AI-Native Observability Meets AI-Driven Telemetry Pipelines
Bindplane now ships a native Oodle destination. Route OpenTelemetry logs, metrics, and traces through Bindplane pipelines into Oodle, with step-by-step setup.
 Sai Prameela Konduru
Product
Meet Oodle: Unified and AI-Native Observability
Watch Oodle debug an alert in the OpenTelemetry Demo: metrics, logs, and traces in one view, plus an AI assistant that finds the root cause in plain English.
Gaurav Maheshwari
Partnerships
Varnish CDN Observability with OpenTelemetry & Oodle AI
Varnish exports cache, latency, and backend telemetry over OpenTelemetry via varnish-otel. Send it to Oodle AI for dashboards and PromQL alerts.
Sai Prameela Konduru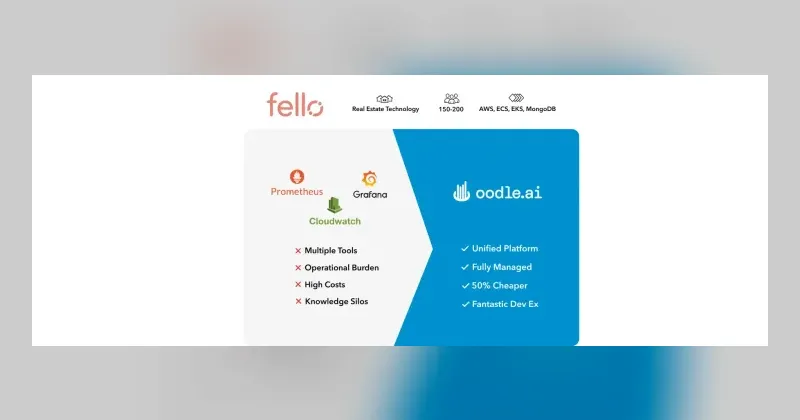
Case Studies
How Fello achieved 100% observability adoption with unified UX at half the cost
Fello moved from CloudWatch, Prometheus, and Grafana to Oodle in hours, cut costs 50% ($70k a year), and went from 13% to 100% of engineers on call.
Sai Prameela Konduru
Product
Dashboards are Dead!
Yes, the static, pre-built dashboard is dead. What replaces it: dynamic, on-demand views that assemble themselves for the incident at hand.
Gaurav Maheshwari
Product
Scaling Prometheus: How to Go From a Single Node to Enterprise-Grade Observability
A single Prometheus server hits memory limits as series grow. How to scale it: sharding, federation, or moving to Thanos, Mimir, or VictoriaMetrics.
Gaurav Maheshwari
News
Oodle.ai - 2024 Year in Review
How Oodle.ai revolutionized observability in 2024 with serverless architecture, 10x cost savings, and AI debugging at KubeCon, PromCon & more.
 Kiran Gollu

Engineering
Go All the Way: Why Golang is Your Swiss Army Knife for Modern Development
Discover why Go is the perfect language for full-stack development. From infrastructure to apps, learn how Go simplifies your tech stack.
Akhilesh Krishnan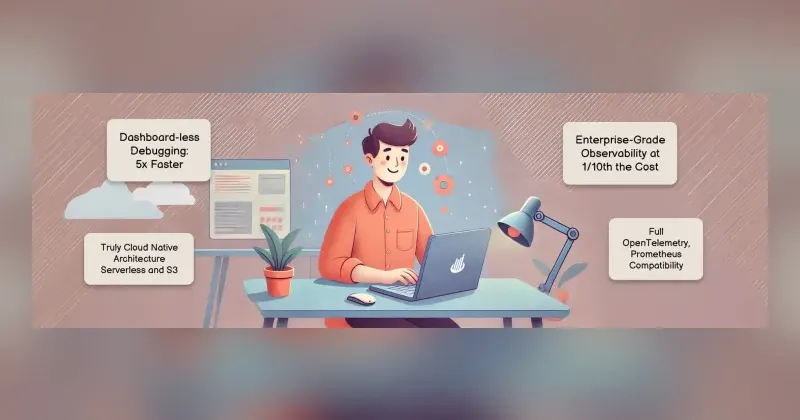
News
Introducing Oodle AI: The fastest, most cost-efficient observability platform
Oodle AI is a serverless, fully managed observability platform, a drop-in Prometheus/ELK replacement at ~1/10th the cost.
Kiran Gollu, Vijay Karthik
Engineering
Go Profiling in Production
Profiling Go in production: net/http/pprof setup, CPU and heap profiles, pprof labels, goroutine leak detection, and Go 1.25's Flight Recorder.
Gaurav Maheshwari
Engineering
Go faster! Golang performance optimization in production
Golang performance optimization from production: buffer reuse, typed pools, GOMEMLIMIT, PGO. One slice fix cut 9.8 GB of allocations to 1 MB.
Vijay Karthik
Engineering
Building a High-Performance, Low-Cost Metrics Observability System
How Oodle built a serverless, Prometheus-compatible metrics system on S3 and AWS Lambda: storage split from compute, 10x cheaper storage, no AZ egress costs.
Vijay KarthikGet new posts by email
Engineering write-ups from the Oodle team.