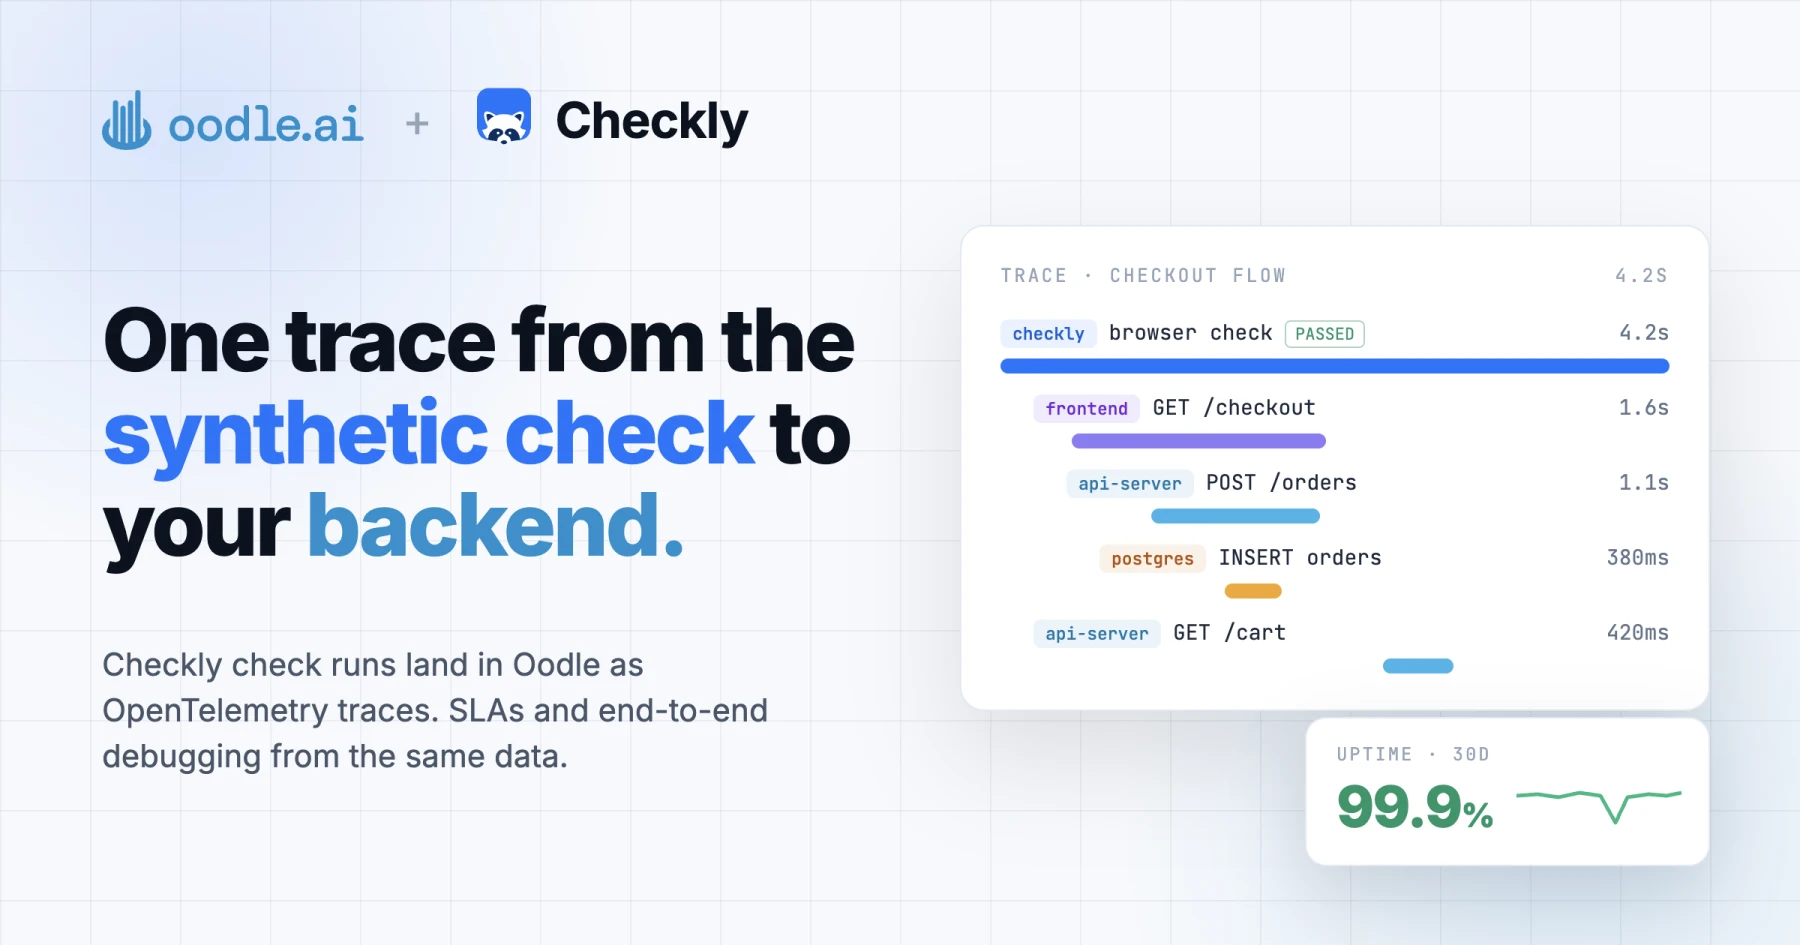
Synthetic checks are usually the first ones to know that something is broken for your users. They are rarely the ones which tell you why. A check goes red, and the next step is to jump to another tool, pick a time window, and search through traces and logs to find the request which the check made.
What if the check run itself was the first span of the trace, and your frontend and backend spans were stitched right under it?
Checkly can now export every check run as an OpenTelemetry span, and Oodle has a native Checkly integration to receive them. In this post, we dive deeper into:
- Setting up the Checkly trace export to Oodle.
- Using check runs to track uptime SLAs.
- End-to-end debugging with the same trace across Checkly, frontend and backend.
The Setup
In Checkly, open Settings > Traces, select Enable exporting traces, and add the Oodle endpoint with two headers:
url: "https://<OODLE_INSTANCE>-otlp.collector.oodle.ai/v1/traces"
headers:
  X-OODLE-INSTANCE: "<OODLE_INSTANCE>"
  X-API-KEY: "<OODLE_API_KEY>"
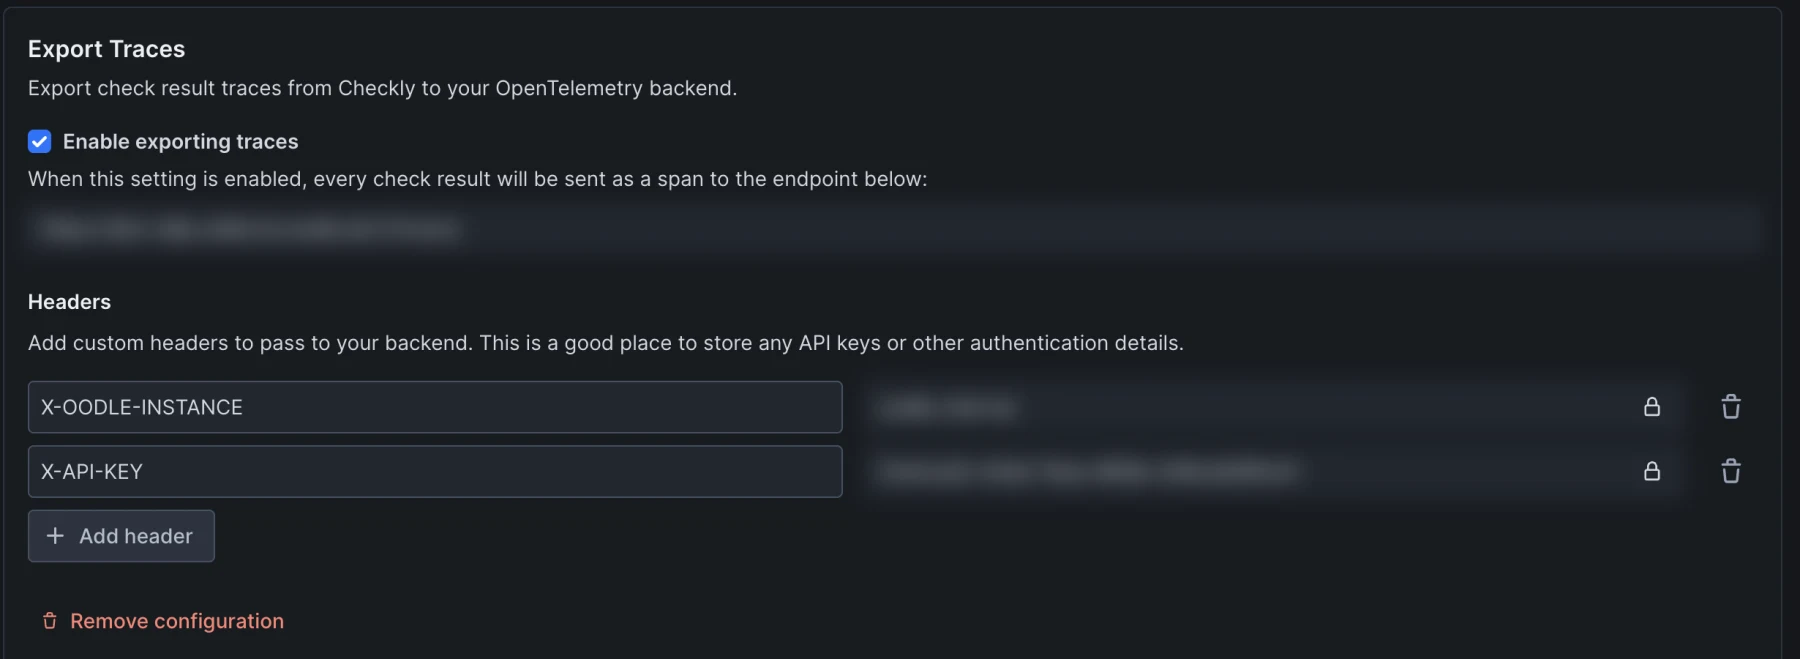
That's it, no collector to run. From the next check run onwards, every run lands in Oodle traces as a span with service.name set to checkly and the check name as the span name. The Checkly tile on Oodle's integrations page shows the above values with your instance filled in, and provisions a Checkly dashboard.
Use case 1: SLAs from check runs
A browser check which logs in and runs through your checkout flow is the closest thing you have to a real user. That makes it a good candidate for an uptime SLA.
Since every check run is a span, Oodle's span metrics (oodle_trace_metrics) already count them, with the check verdict as a label. Uptime is then a ratio of passed runs to all runs:
sum(increase(oodle_trace_metrics{service_name="checkly", checkly_check_status="PASSED"}[30d]))
/
sum(increase(oodle_trace_metrics{service_name="checkly"}[30d]))
* 100
The Checkly dashboard in Oodle has SLA panels built on top of this:
| Panel | Shows |
|---|---|
| Uptime percentage | Passed runs as a share of all runs |
| Failed runs | Runs with status FAILED or DEGRADED |
| Avg check duration | Average run time of the checks |
| Pass rate by check | Uptime for each check |
| Failed runs by check | Which checks fail the most |
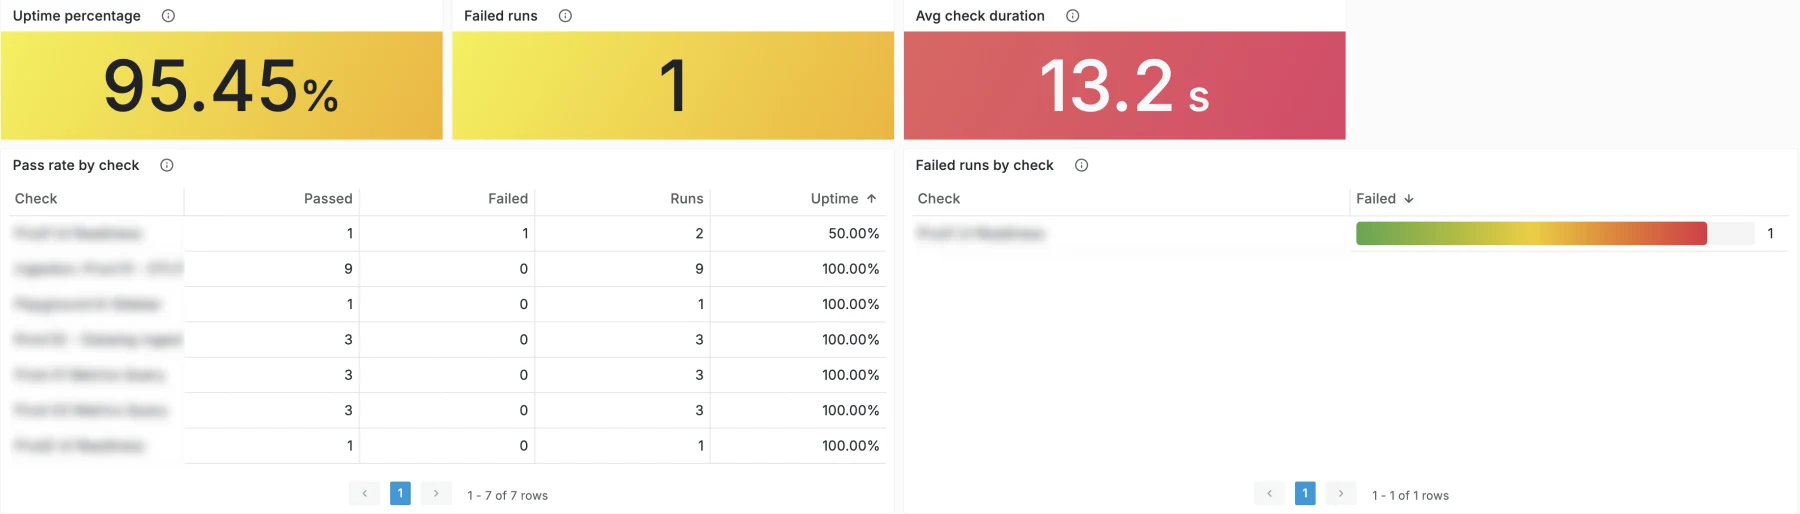
Check and location variables filter every panel, so you can tell whether a check fails from all regions, or only from one. And since uptime is just a PromQL query, you can put a monitor on it and get notified when a check's pass rate drops below your SLA target.
Use case 2: End-to-end debugging
This is the part I find most useful.
For Browser checks written with @playwright/test, Checkly adds the W3C traceparent header to every request the browser sends. If your frontend and backend honor this header, their spans join the trace of the check run, because the trace ID in the header is the same as the one Checkly exports. One check run gives you one trace: from the Checkly region, through your frontend, down to your backend services.
We run a Checkly browser check against Oodle itself. The check run in Checkly shows the trace ID:
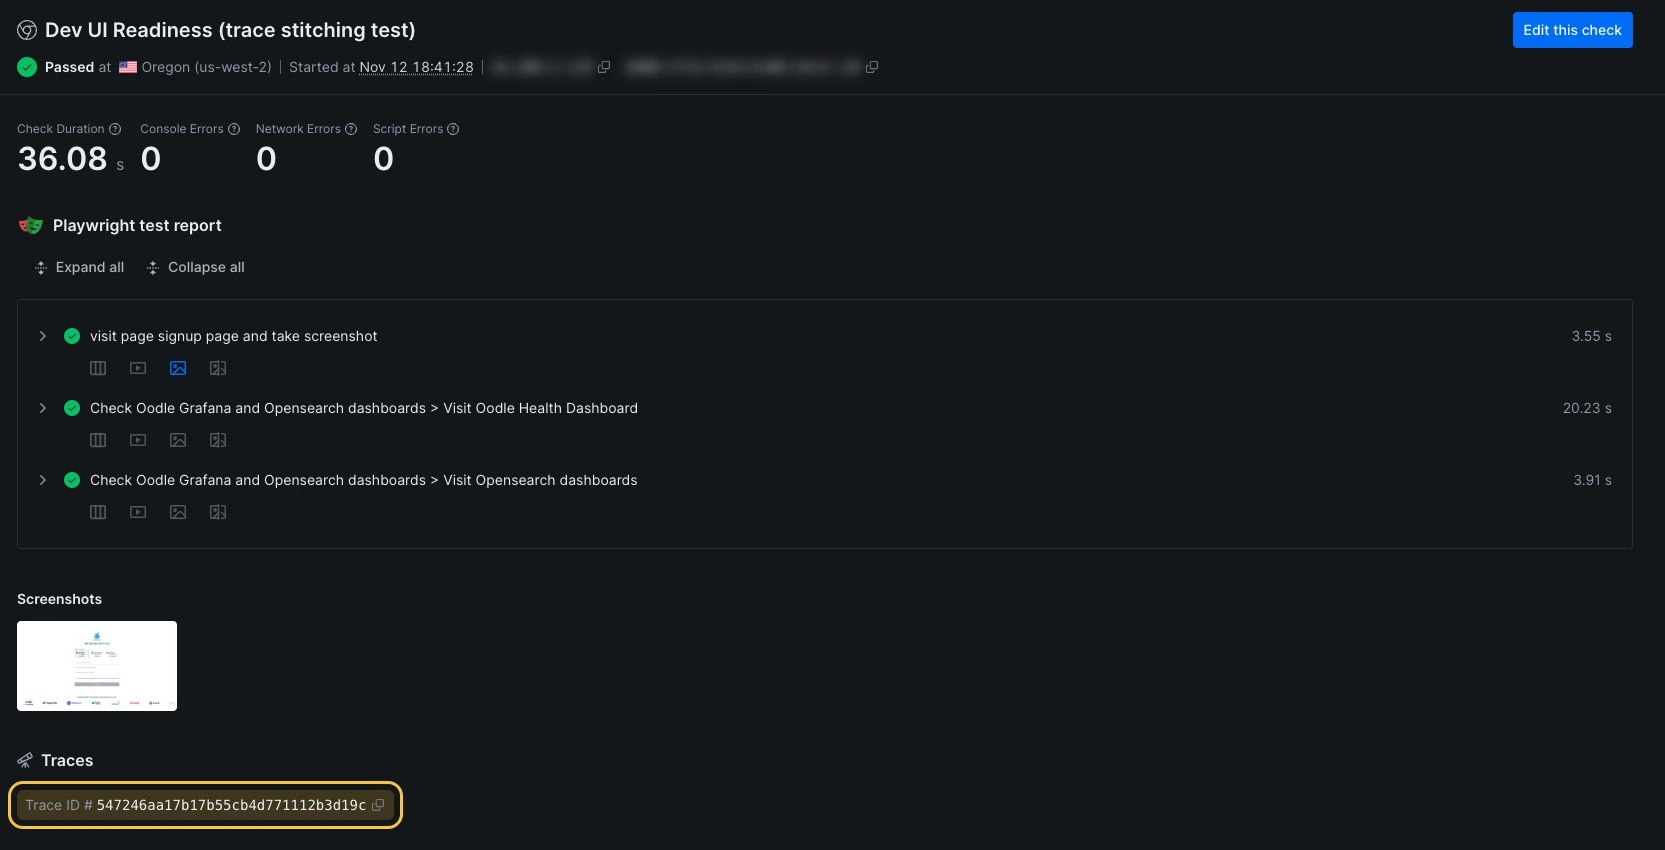
Looking up the same trace ID in Oodle gives the entire run. The checkly span is the entry point. It calls our Next.js frontend (oodle-frontend-app), which in turn calls api-server and the services behind it. Since the browser also calls the API directly, you can see checkly calling api-server as well.
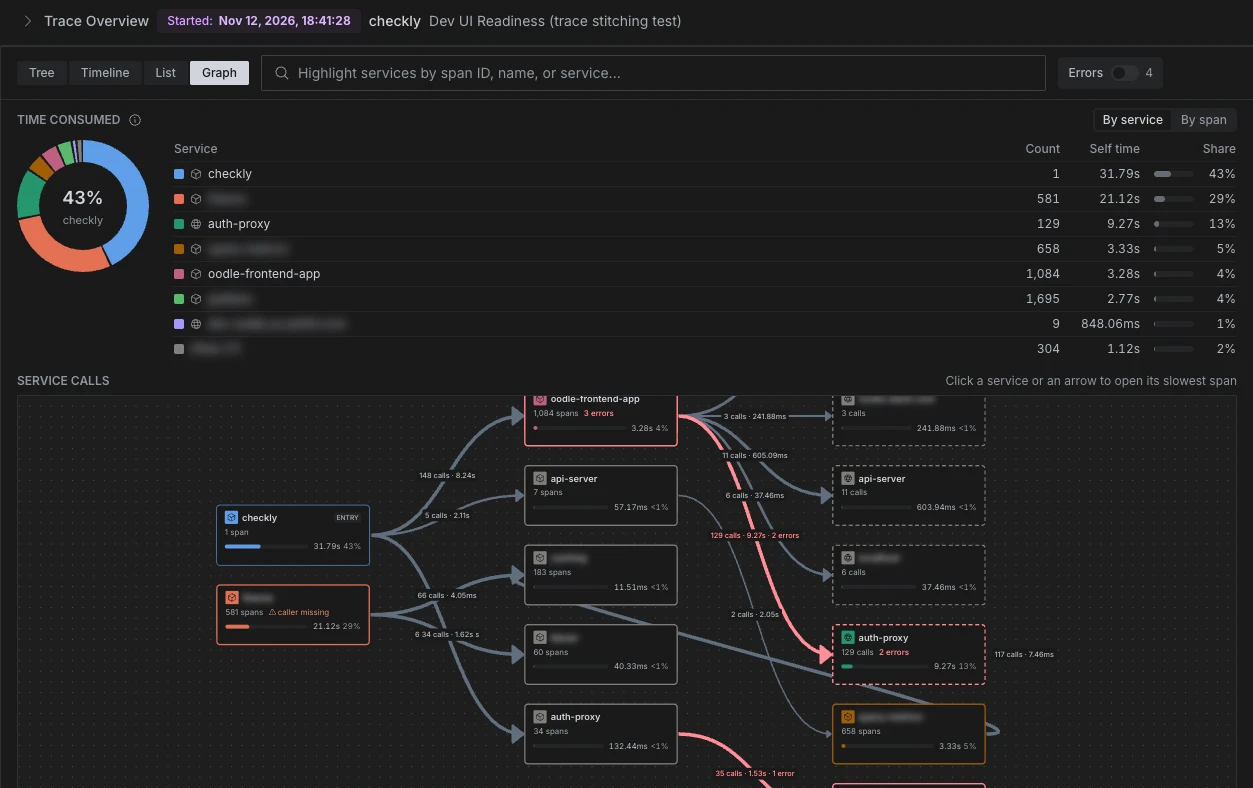
When a check fails, there is no time window to guess. Open the trace, find the failing span, and the Logs tab shows the logs carrying the same trace ID.
Honoring traceparent
Most OpenTelemetry SDKs already read traceparent, you only need to turn on tracing with the W3C propagator. Below snippets are trimmed down from what we run in production.
Next.js frontend: register the OpenTelemetry Node SDK through Next.js's instrumentation hook:
// instrumentation.ts
export async function register() {
  if (process.env.NEXT_RUNTIME === 'nodejs') {
    await import('./instrumentation.node');
  }
}
// instrumentation.node.ts
import { NodeSDK } from '@opentelemetry/sdk-node';
import { getNodeAutoInstrumentations } from '@opentelemetry/auto-instrumentations-node';

const sdk = new NodeSDK({
  instrumentations: [getNodeAutoInstrumentations()],
});

sdk.start();
The HTTP auto-instrumentation extracts traceparent from incoming requests, so the server span becomes a child of the Checkly span. It also injects traceparent into outgoing calls to your backend. Point the exporter to Oodle using the standard environment variables:
OTEL_SERVICE_NAME=my-frontend
OTEL_EXPORTER_OTLP_ENDPOINT=https://<OODLE_INSTANCE>-otlp.collector.oodle.ai
OTEL_EXPORTER_OTLP_HEADERS=X-OODLE-INSTANCE=<OODLE_INSTANCE>,X-API-KEY=<OODLE_API_KEY>
Go backend: set the W3C propagator at startup, and wrap your HTTP handler with otelhttp:
import (
	"net/http"

	"go.opentelemetry.io/contrib/instrumentation/net/http/otelhttp"
	"go.opentelemetry.io/otel"
	"go.opentelemetry.io/otel/propagation"
)

func main() {
	// Tracer provider setup goes here.

	otel.SetTextMapPropagator(propagation.NewCompositeTextMapPropagator(
		propagation.TraceContext{},
		propagation.Baggage{},
	))

	mux := http.NewServeMux()
	// mux.HandleFunc(...)

	http.ListenAndServe(":8080", otelhttp.NewHandler(mux, "api"))
}
Don't skip SetTextMapPropagator. The Go SDK's default global propagator is a no-op, in which case otelhttp ignores the incoming header and every request starts a new trace.
If you also want the browser's own spans in the same picture, Oodle's RUM SDK can trace fetch/XHR calls and propagate traceparent to your APIs.
What breaks the stitching
- Your check sets
extraHTTPHeaders. Checkly then doesn't addtraceparenton Browser and Multistep checks. Either drop the override, or set the header yourself from theCHECKLY_TRACEPARENTenvironment variable. - A proxy or CDN strips the header. If the trace stops at your edge, look there first.
- A service without a propagator. The trace splits into two, and the second half has a new trace ID without a
checklyroot.
From alert to trace in one click
Checkly webhooks can include the trace ID as {{OTEL_TRACE_ID}}. Add a link to Oodle's trace lookup in your alert payload:
https://<your-oodle-url>/traces/lookup?traceId={{OTEL_TRACE_ID}}
Wrapping up
Synthetic checks and backend telemetry have lived in separate tools for long. With trace export and traceparent, a check run is no longer a red dot with a screenshot, it is the root of a trace which goes all the way to your backend. And because the same spans also become metrics, the SLA report and the debugging session start from the same data.
If you already use Checkly, turning this on is a settings change. Check out the Checkly integration docs, or play around with traces in the Oodle playground.