Debug LLM Calls With Full Request Context
Track tokens, costs, prompts, and tool calls - inside the traces you already send.
OpenTelemetry native. 10x more affordable than standalone tools.
Why Monitor LLMs in Your Observability Platform
Your LLM call is just a span in a trace. It talks to your API, your database, your cache. Monitor it in the same place.
LLM + Traditional Observability, Unified
When a model call is slow, see if it's the prompt, the network, or a downstream database query - without switching tools.
OpenTelemetry Native
Built on open-source conventions for LLMs - use the OpenTelemetry instrumentation libraries you already have.
Affordable at Scale
No sampling required - retain 100% of your traces with full prompt and response content at production scale.
Everything You Need for Production LLM Debugging
Deep LLM insights extracted from your OpenTelemetry traces.
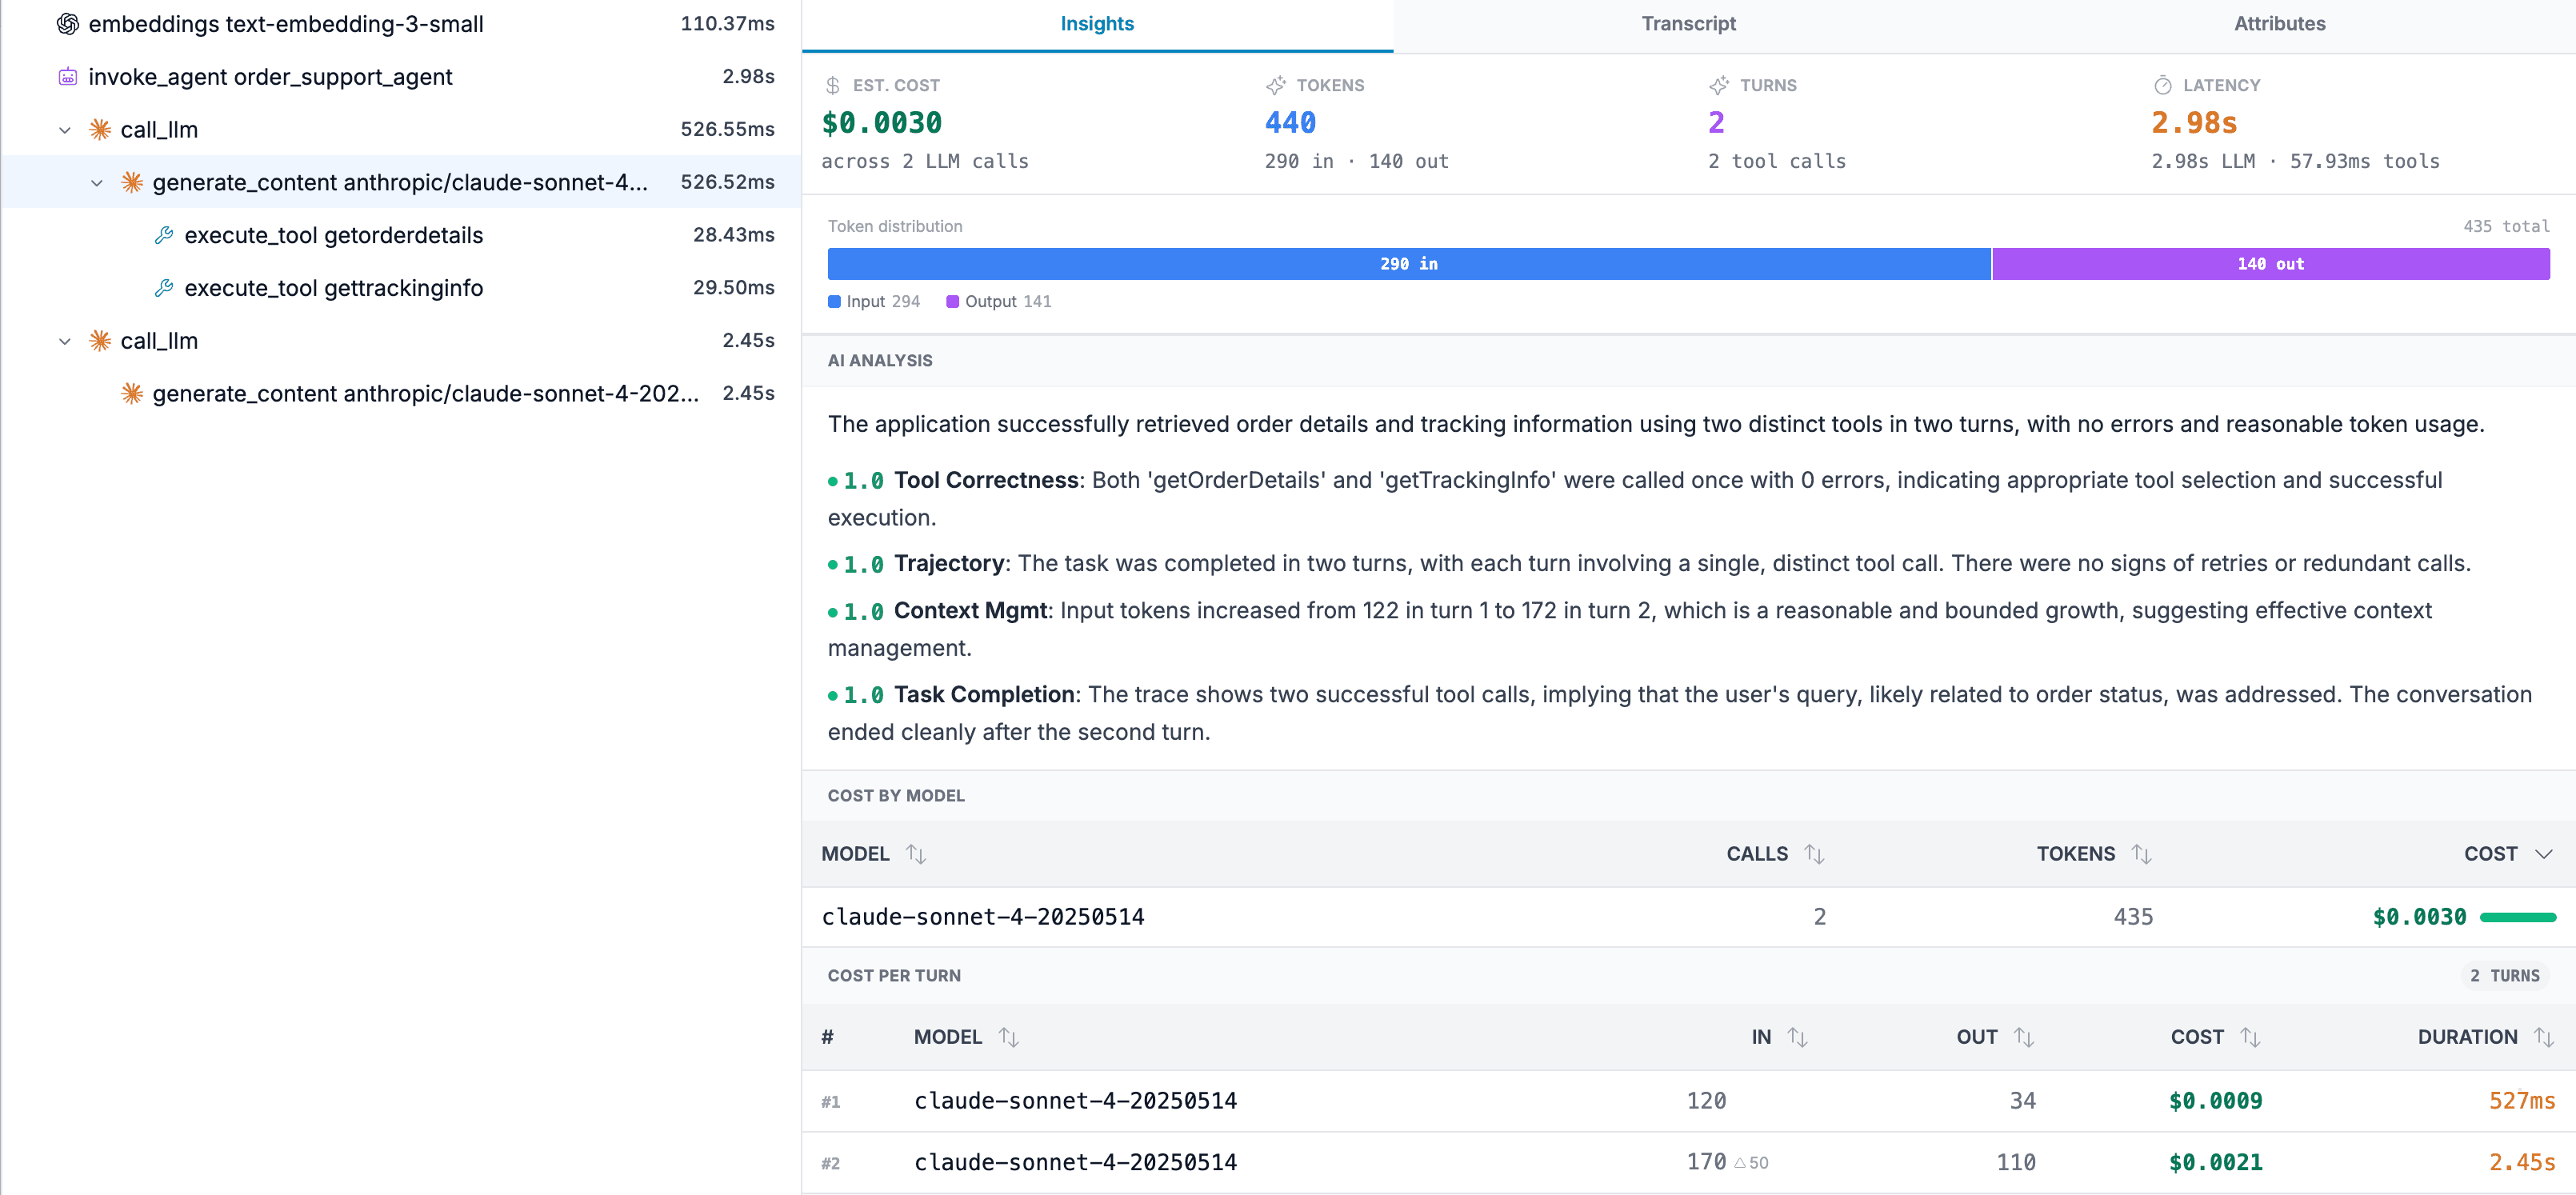
Token Usage Tracking
Input, output, and reasoning tokens broken down per span. Spot runaway prompts and budget overruns before they hit your bill.

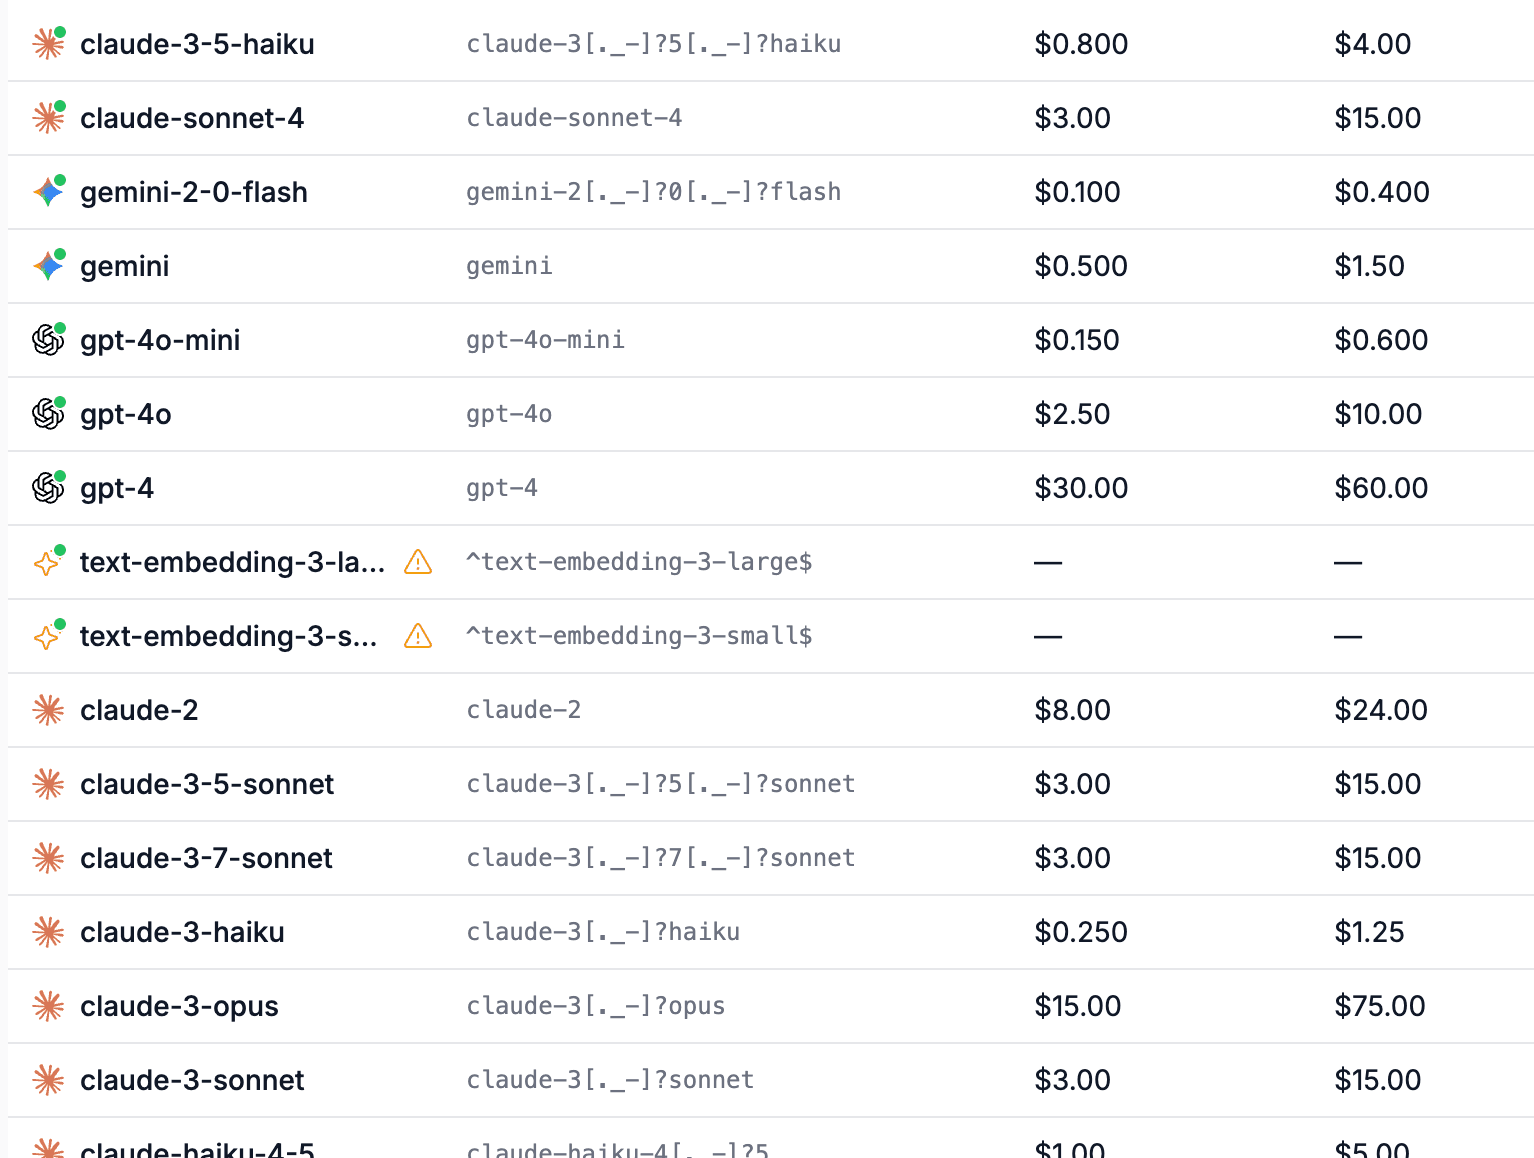
Cost Estimation with Configurable Pricing
Estimated cost per trace, per model, per service. 50+ model pricing definitions shipped by default - OpenAI, Anthropic, Google, Mistral, Cohere, and more. Add custom or fine-tuned models in the UI.
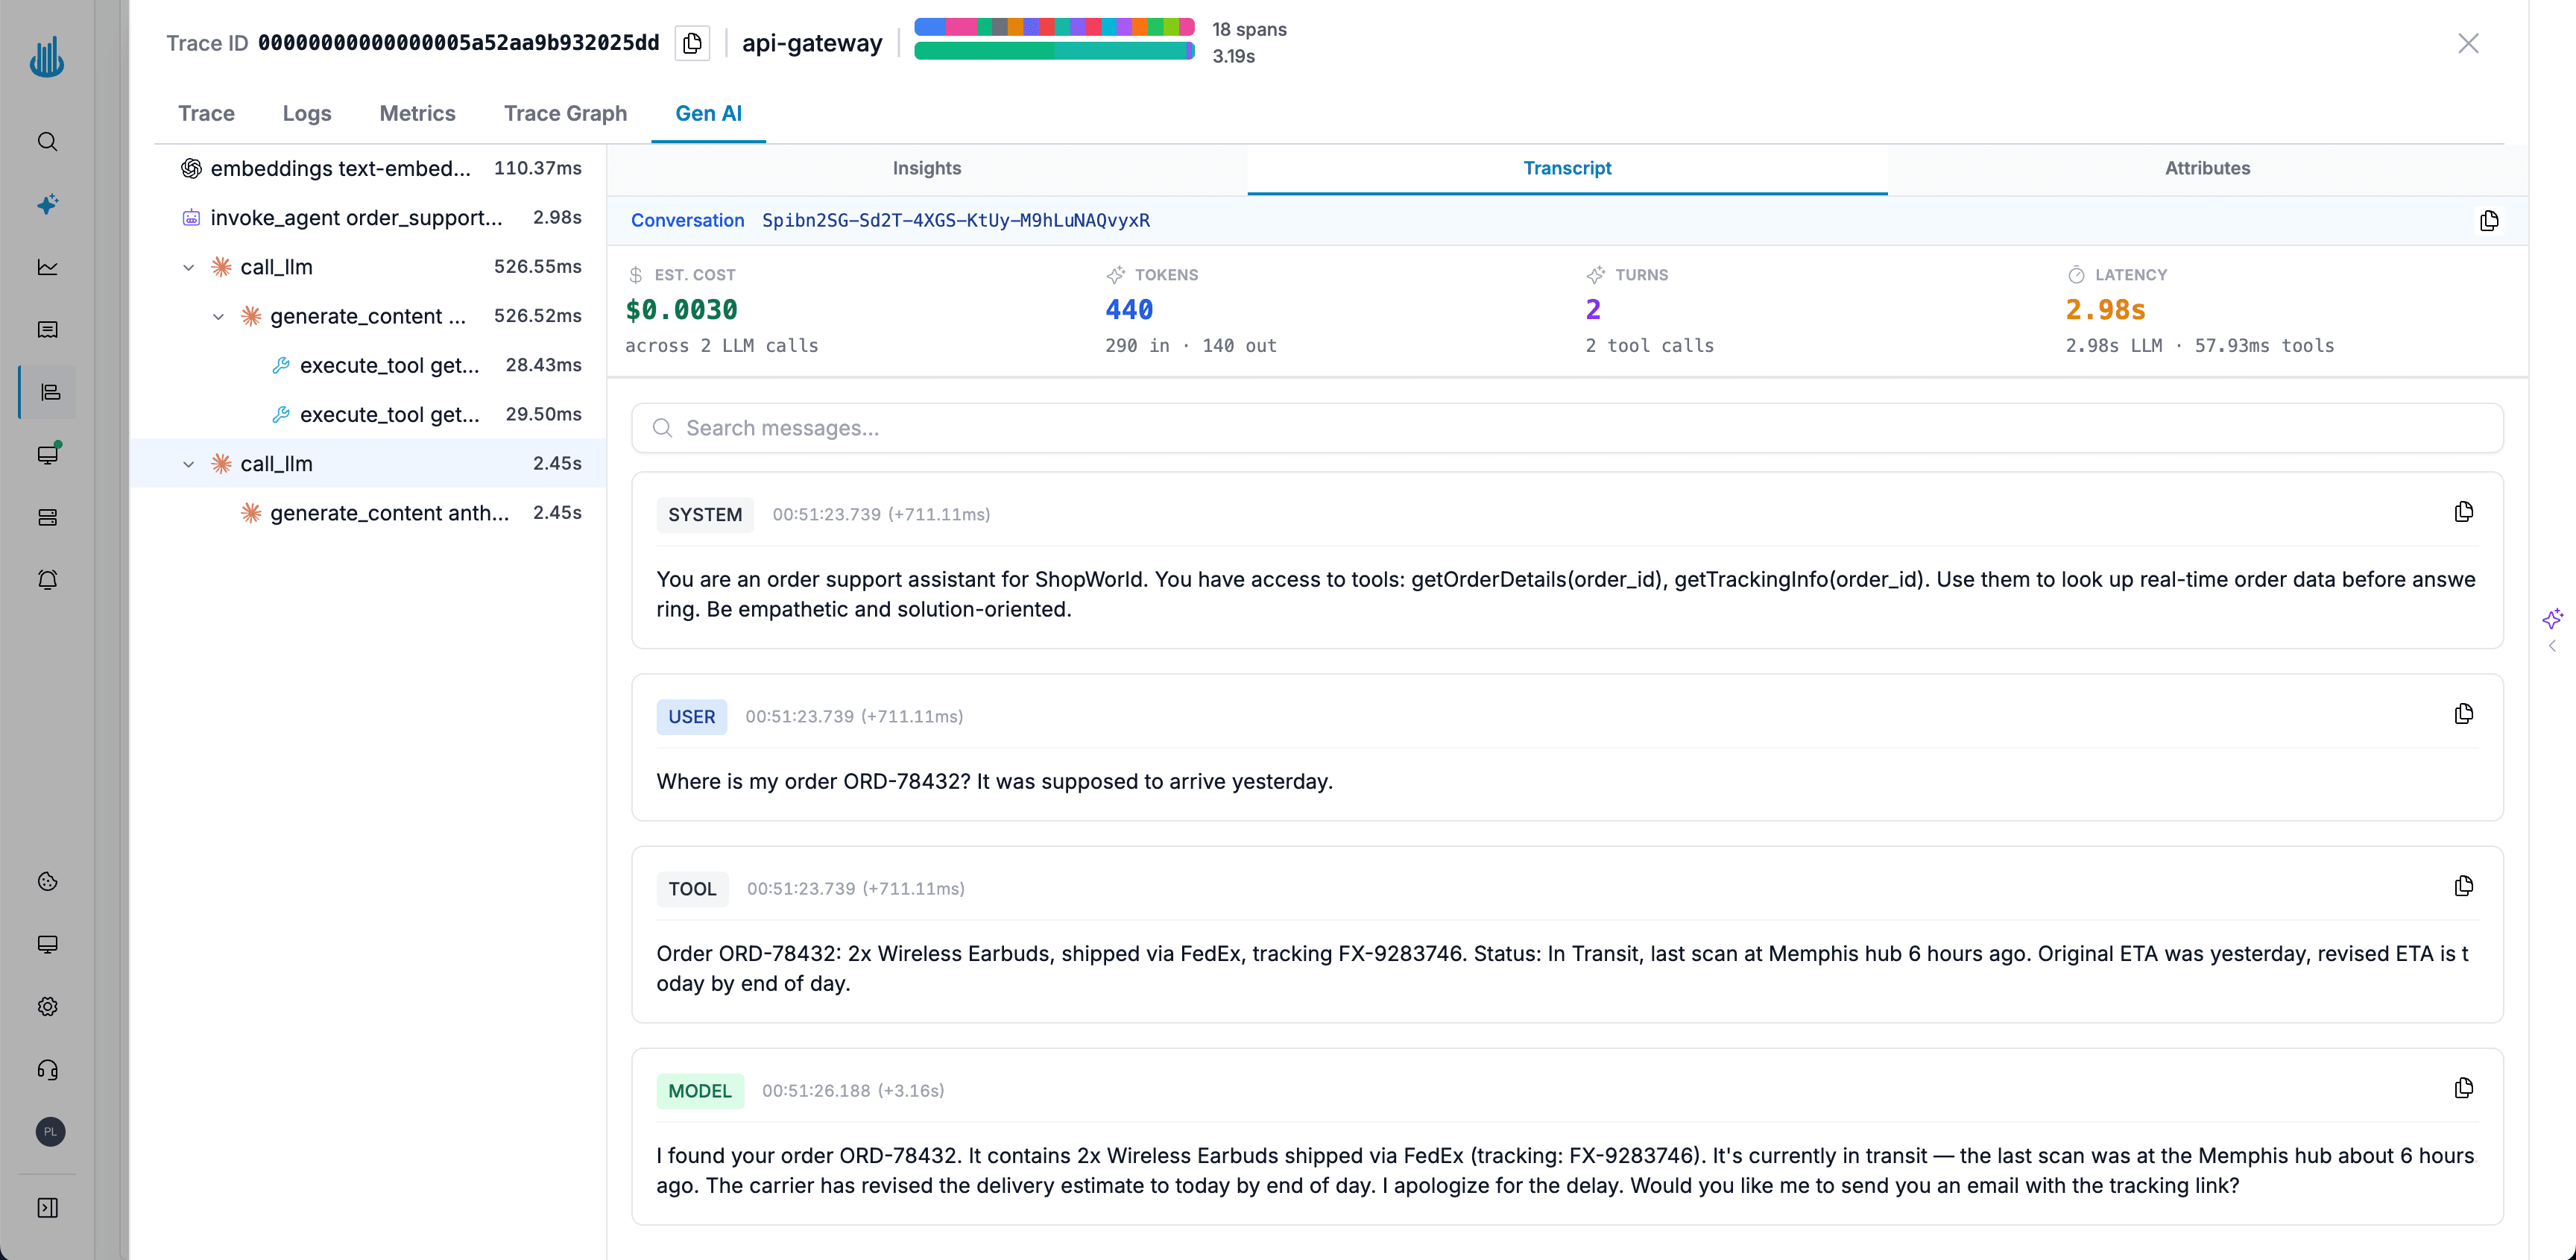
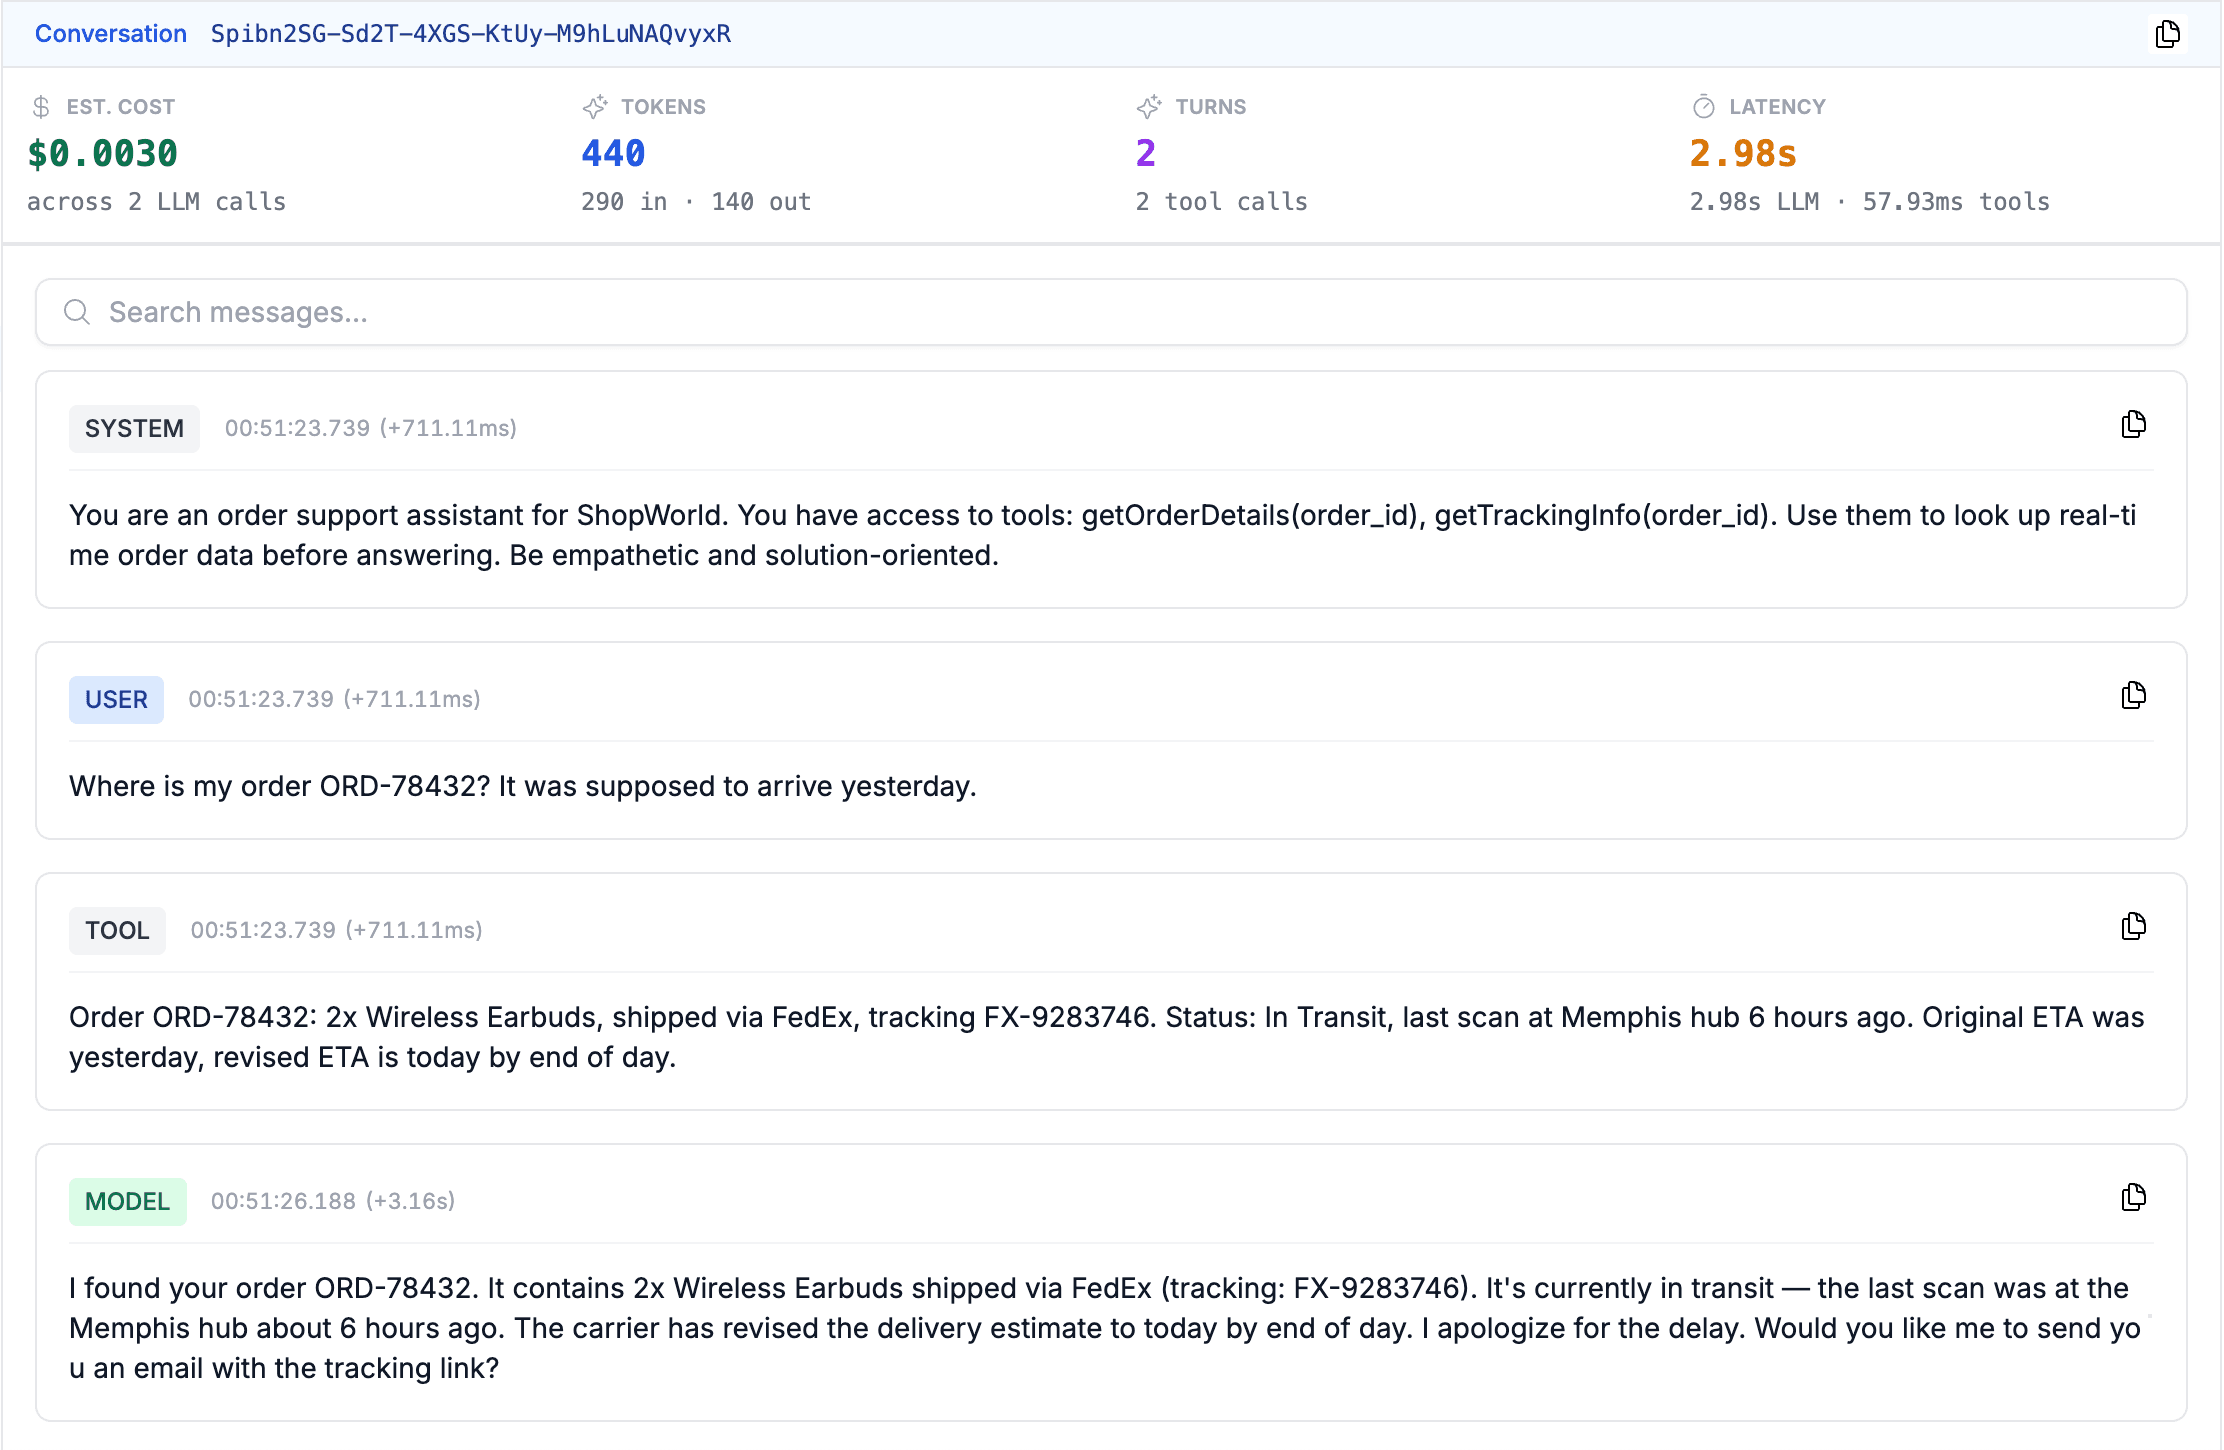
Full Prompt/Response Transcript Replay
Read the exact multi-turn conversation: system, user, assistant, and tool messages. Debug hallucinations and prompt issues in context.
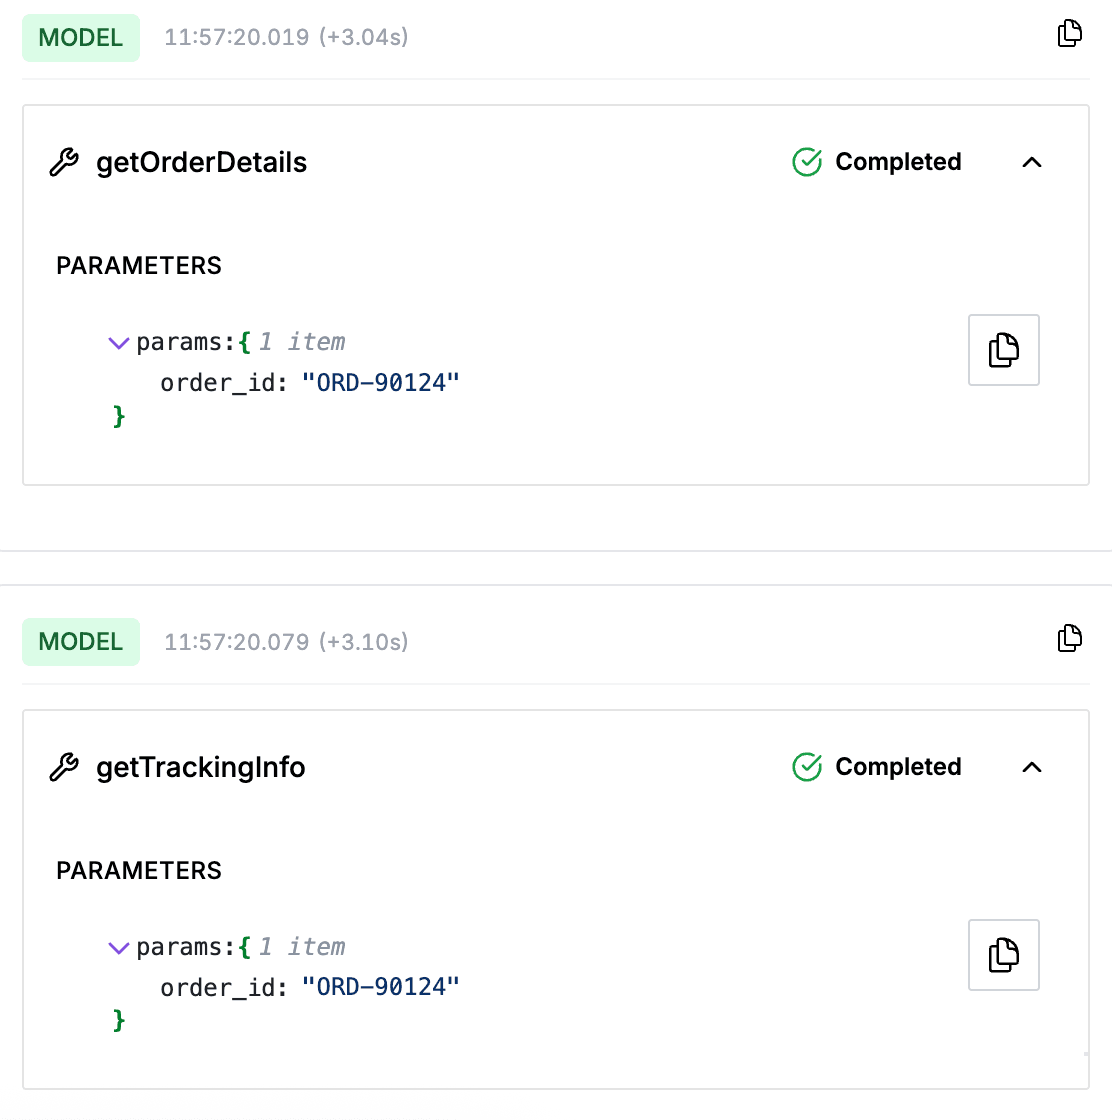
Tool Call Analysis
See every tool invocation with its schema, arguments, and response. Identify which tools fail, timeout, or return unexpected results.
AI-Powered Trace Quality Scoring
Automated quality scores on LLM traces flag low-confidence, potentially harmful, or off-topic responses without manual review.
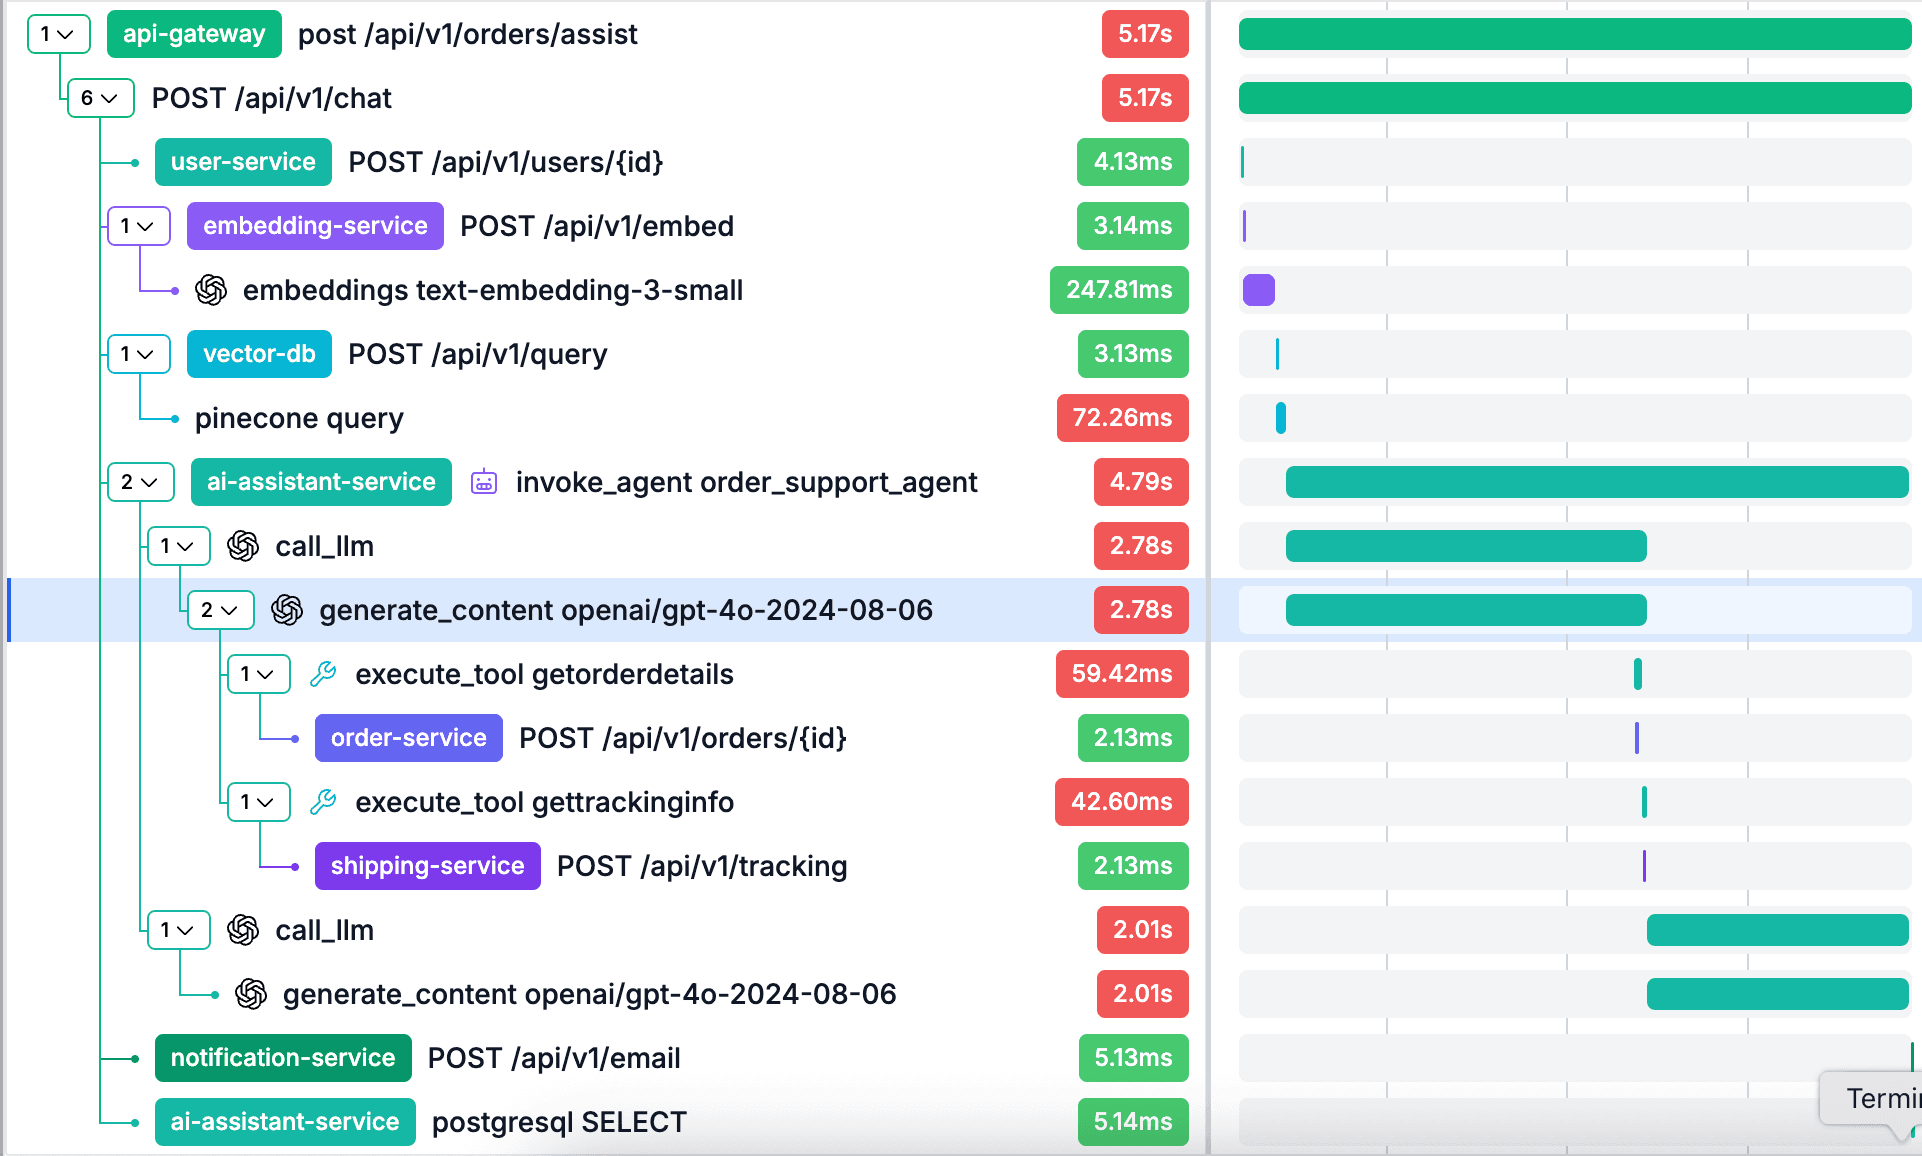
Trace Waterfall with LLM Span Highlighting
LLM spans stand out in your trace waterfall with provider icons and GenAI attributes. See how model calls fit into the full request lifecycle.
How It Works
Three steps from zero to full LLM visibility.
Instrument with OTel GenAI Conventions
Use any OpenTelemetry-compatible instrumentation library that emits Generative AI semantic conventions - LangChain, Vercel AI SDK, OpenLLMetry, or roll your own.
Send Traces to Oodle
Point your OTLP exporter at your Oodle instance. Same endpoint you already use for backend traces - one config line, no new collector.
See LLM Data Alongside Everything Else
Oodle automatically extracts tokens, cost, transcripts, and quality scores from your GenAI spans. No configuration - it just works.
Lower LLM Trace Costs
“This is cheaper in terms of storage and ingestion everything.”
- Vinay Krishna, Senior DevOps Engineer, Fello
Compare LLM Pricing →See It In Your Environment
Book a call to see how Oodle handles your LLM traces - with your data, your models, your scale.
Frequently Asked Questions