Best CloudWatch alternative
for fast, affordable logs.
CloudWatch makes you write queries, wait for scans, and pay per GB scanned.Oodle AI searches AWS logs in one click, finds root causes, and costs 40% less.
“We replaced CloudWatch Logs with Oodle. Honestly, we’d have settled for half the cost and 90% of the features, but Oodle is faster and better across the board.”
 Suman Varanasi
Co-founder and CTO, Fello
Why are teams choosing Oodle AI over CloudWatch?
Simple
- Click-based filtering without complex queries
- Free text search
- Minimal learning curve with familiar Lucene query language
Fast
- Lightning-fast query performance
- Global view across all log groups, regions, and accounts
- Debug faster with correlations between metrics and logs
Cost-efficient
- Typically 40% lower bills than CloudWatch. No catch.
- Predictable, all-inclusive pricing
- Affordable retention
Oodle AI vs CloudWatch, feature by feature
CloudWatch collects everything AWS emits. Getting answers out is the hard part: the query language, per-region scoping, and scan charges are what send teams looking for CloudWatch alternatives.
 Oodle AI
 CloudWatch
See the difference on your own logs.
Try the PlaygroundCloudWatch pricing vs Oodle AI pricing
One meter versus many. The same log components, priced side by side.
| Component | Oodle AI | CloudWatch |
|---|---|---|
| Ingestion | $0.30 / GB | $0.50 / GB |
| Retention | 30d (up to 1 year) | $0.03 / GB / mo |
| Log-based Metrics | $0.06 / metric / mo | $0.30 / metric / mo |
| Queries | Unlimited, no scan meter | $0.005 / GB scanned |
| Dashboards | Unlimited dashboards | $3 / dashboard / mo |
| Alerting | Unlimited alerts | $0.10 / alarm / mo |
| Users | Unlimited seats | Included |
CloudWatch figures are AWS public pricing for the standard log class in US East (Jul 2026). Oodle AI figures are the logs plan on oodle.ai/pricing.
What to look for in a CloudWatch alternative
Four dimensions separate a real replacement from a lateral move. Here’s where each side lands.
Scalability & performance
Logs Insights scans raw logs on every query, so speed falls as the time range grows, exactly when an incident needs a wide search. Judge an alternative on worst-case search speed, not the demo query.
Serverless, S3-backed: sub-second p99 search held at petabyte scaleQueries scan raw logs; wide time ranges crawl during incidentsIntegration capabilities
CloudWatch is AWS-native and stops at the AWS boundary. An alternative should pull from your AWS accounts on day one without re-instrumenting, and alert where your team actually lives.
One-click CloudWatch import, Firehose, OTel, Fluentd; native Slack and PagerDutyAWS sources only; alerts reach Slack or PagerDuty through SNS wiringCost structure
CloudWatch bills three meters on logs: $0.50/GB to ingest, $0.03/GB-month to store, and $0.005 per GB scanned on every Logs Insights query. The scan meter is why a busy incident week raises the bill.
Flat $0.30/GB ingested; storage, queries, and alerts included$0.50/GB ingest + $0.03/GB storage + $0.005/GB scanned per queryEase of use
In CloudWatch, every answer starts with Logs Insights query syntax and knowing which log group to search. An incident tool should not require a query language between an engineer and the root cause.
Full-text search and one-click filters across all logs; no query languageLogs Insights syntax per query, scoped log groups, console context-switchingSee it in the product
Four Oodle AI capabilities that replace the slowest parts of CloudWatch, plus the connectors for your AWS logs and metrics.
Log Patterns
- Auto-group logs by fingerprint similarity
- View pattern frequency and distribution
- Identify recurring issues at a glance
Log Anomaly Detection
- New Patterns: Errors that haven’t appeared before
- Spikes: Sudden increases in existing errors
- High Volume: Recurring errors with high rates
- Toggle detectors on/off, block noisy anomalies
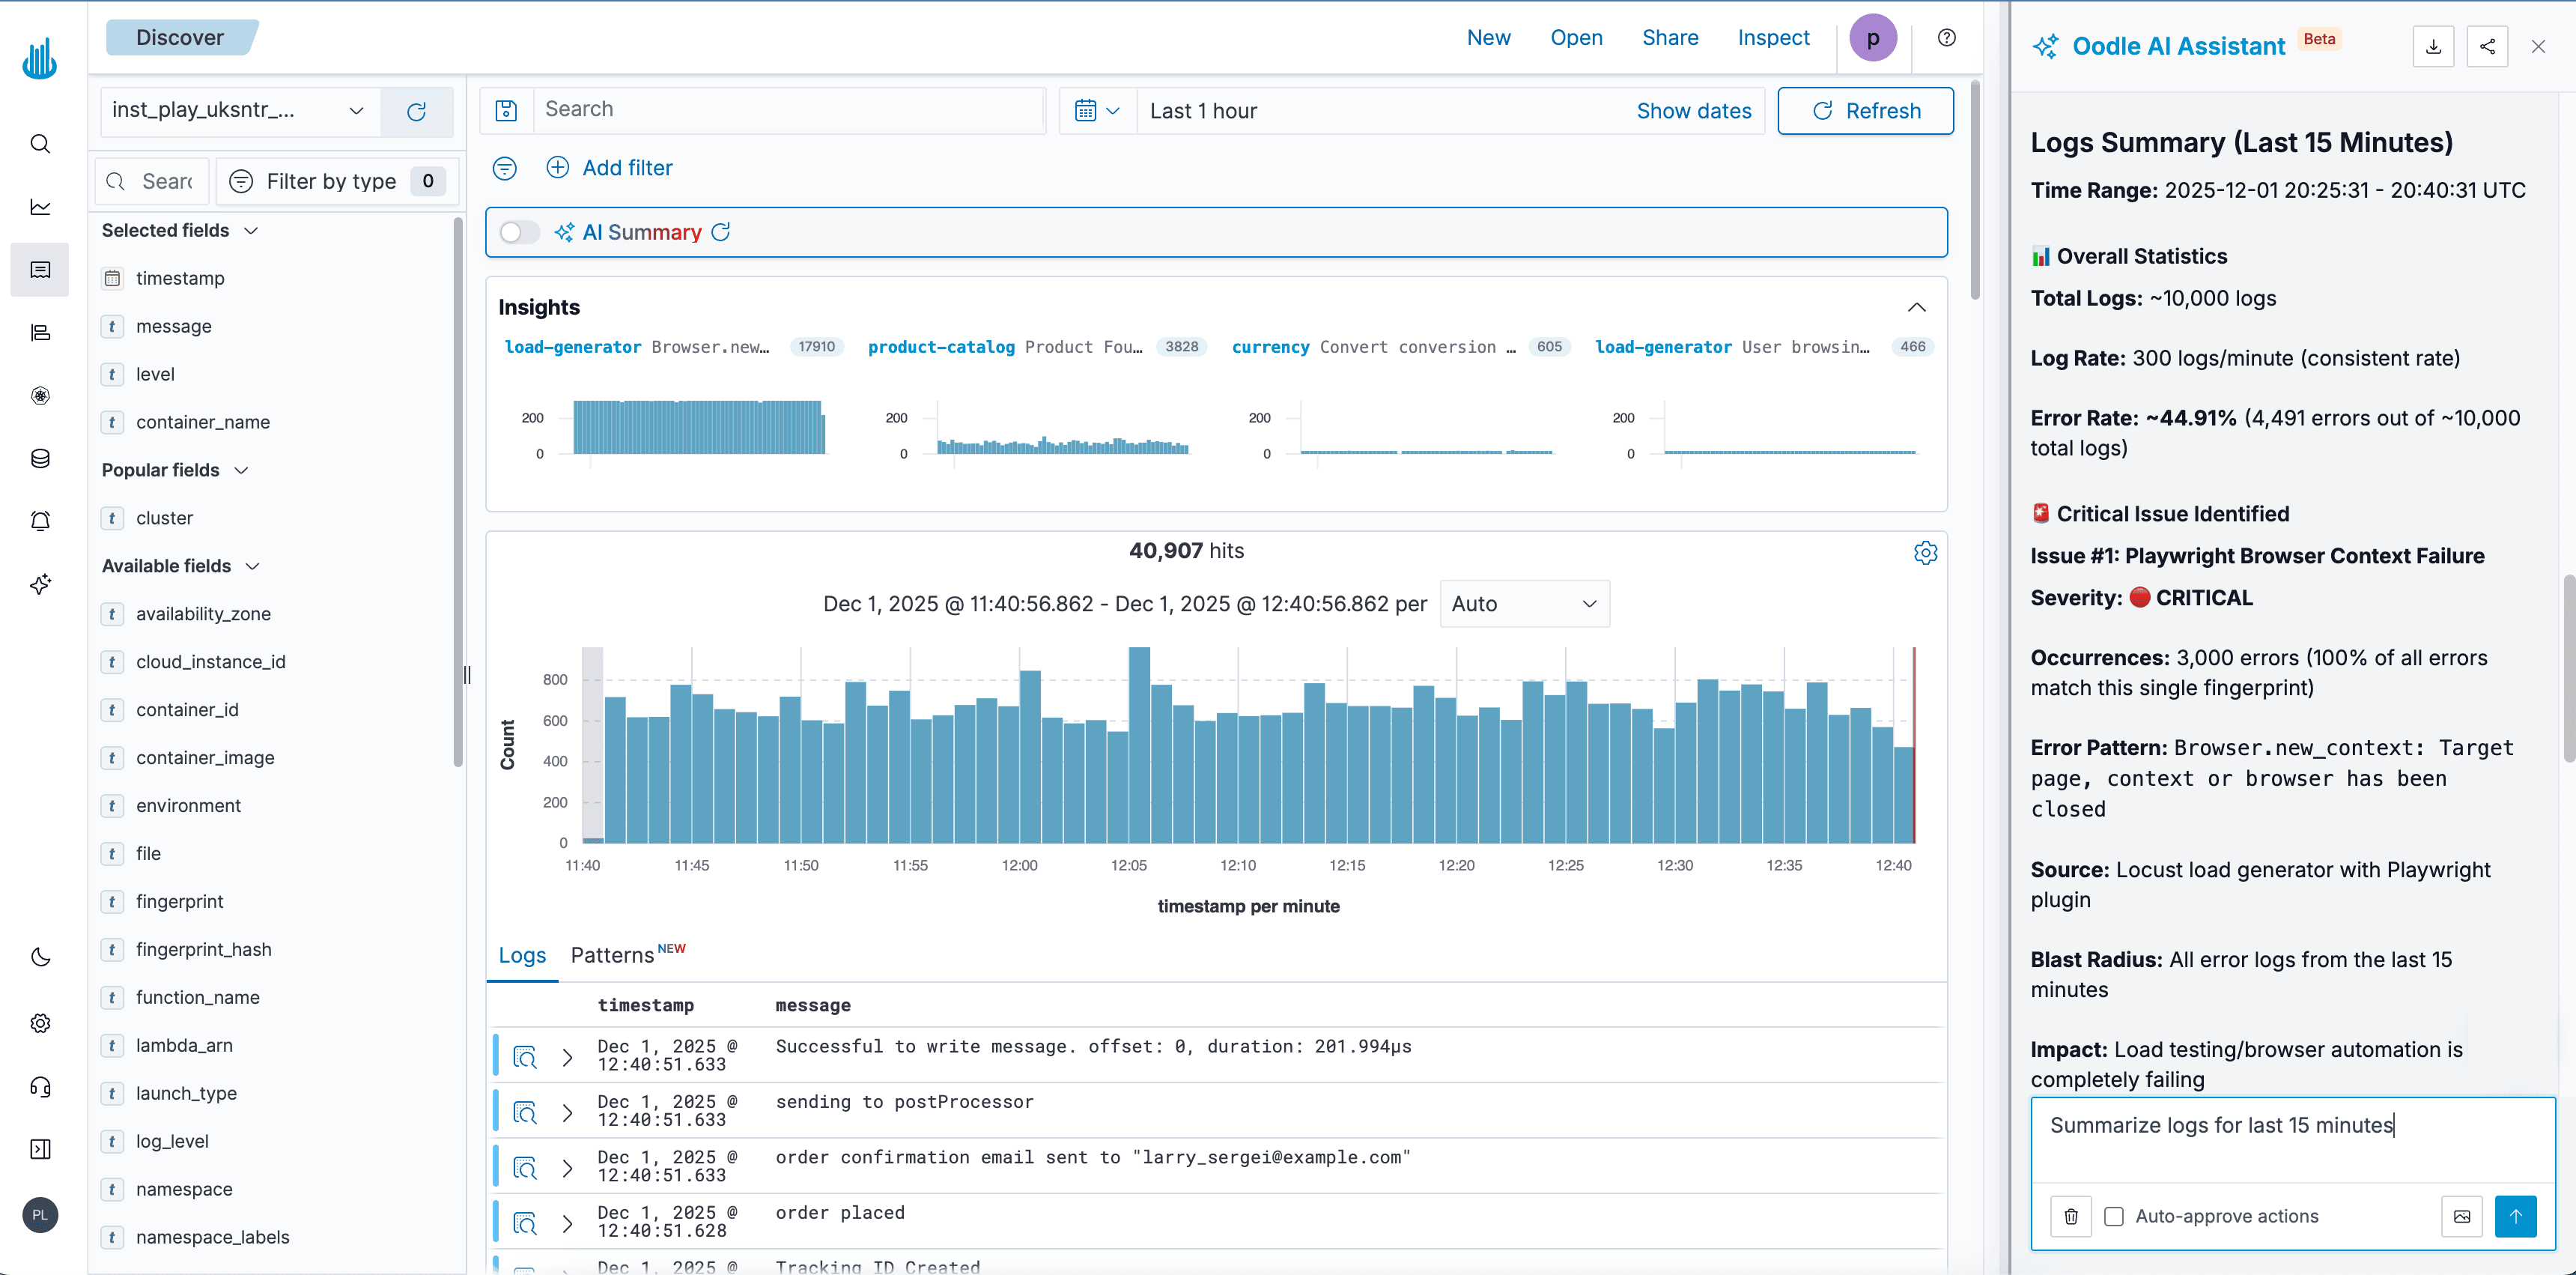
AI Log Summary
- Total log count, rate, and error percentage
- Critical issues with severity ratings
- Root cause identification and impact analysis
Cross-Signal Navigation
- Service Graph showing dependencies
- Distributed traces with spans and timing
- CPU and memory metrics at the log timestamp
- All traces filtered by service and timeframe
Connect CloudWatch Logs
- Guided setup deploys one CloudFormation stack
- Pick the log groups to stream; no agents, no code changes
- CloudWatch keeps running while you verify side by side
- Logs are searchable in Oodle AI in minutes
Connect CloudWatch Metrics
- Pick a region and namespaces: EC2, RDS, ElastiCache, and more
- Apply the generated CloudFormation stack and you are done
- Prebuilt AWS dashboards light up with your data
- Metrics land next to your logs, not in a second tool
Trusted by teams like yours

“Oodle replaced CloudWatch, OpenSearch, Splunk with a single, faster platform. Log search is much faster than our AWS OpenSearch, and built-in alerting and RBAC are exactly what we needed.”
 Srikanth GaddamCTO, Zaggle













Frequently asked questions
What is the best CloudWatch alternative?
Oodle AI is the managed alternative AWS teams pick when CloudWatch queries slow down and scan charges pile up. It connects to your AWS accounts in one click, searches logs in under a second with no query language, and prices one flat meter at $0.30/GB, typically about 40% lower overall. Most teams connect in 2-3 hours and validate within a day or two.
Why is CloudWatch so expensive?
Three meters run at once: $0.50/GB to ingest, $0.03/GB per month to store, and $0.005 per GB scanned every time you query. The scan meter is the trap; one bad incident week can double the bill. Oodle AI prices one meter, so cost scales with your traffic, not your worst outage.
Wait, isn’t native CloudWatch integration simpler?
Ingestion is the same either way: Fluentd, Vector, OTel, or AWS Firehose, no application code changes. What changes is everything after ingestion: search speed, one cross-region view, and a bill without a query meter.
How do I migrate from CloudWatch to Oodle AI?
Three steps. Point the agents you already run (Fluentd, Vector, OTel, or AWS Firehose) at Oodle AI and dual-write next to CloudWatch; no application code changes (setup guides). Verify side by side, then cut over: Grafana dashboards import directly and alarms are recreated with context-aware alerting. Most teams connect in 2-3 hours and validate within a day or two, and Oodle AI’s team handles the migration with you.
How does Oodle AI compare with other CloudWatch alternatives?
Datadog is powerful but its per-host and indexing pricing grows steeply. Managed Loki brings LogQL’s learning curve and label-cardinality limits (see the Loki comparison). Self-hosted ELK means running the cluster yourself (see the ELK comparison). Oodle AI is the managed option built specifically for this migration.