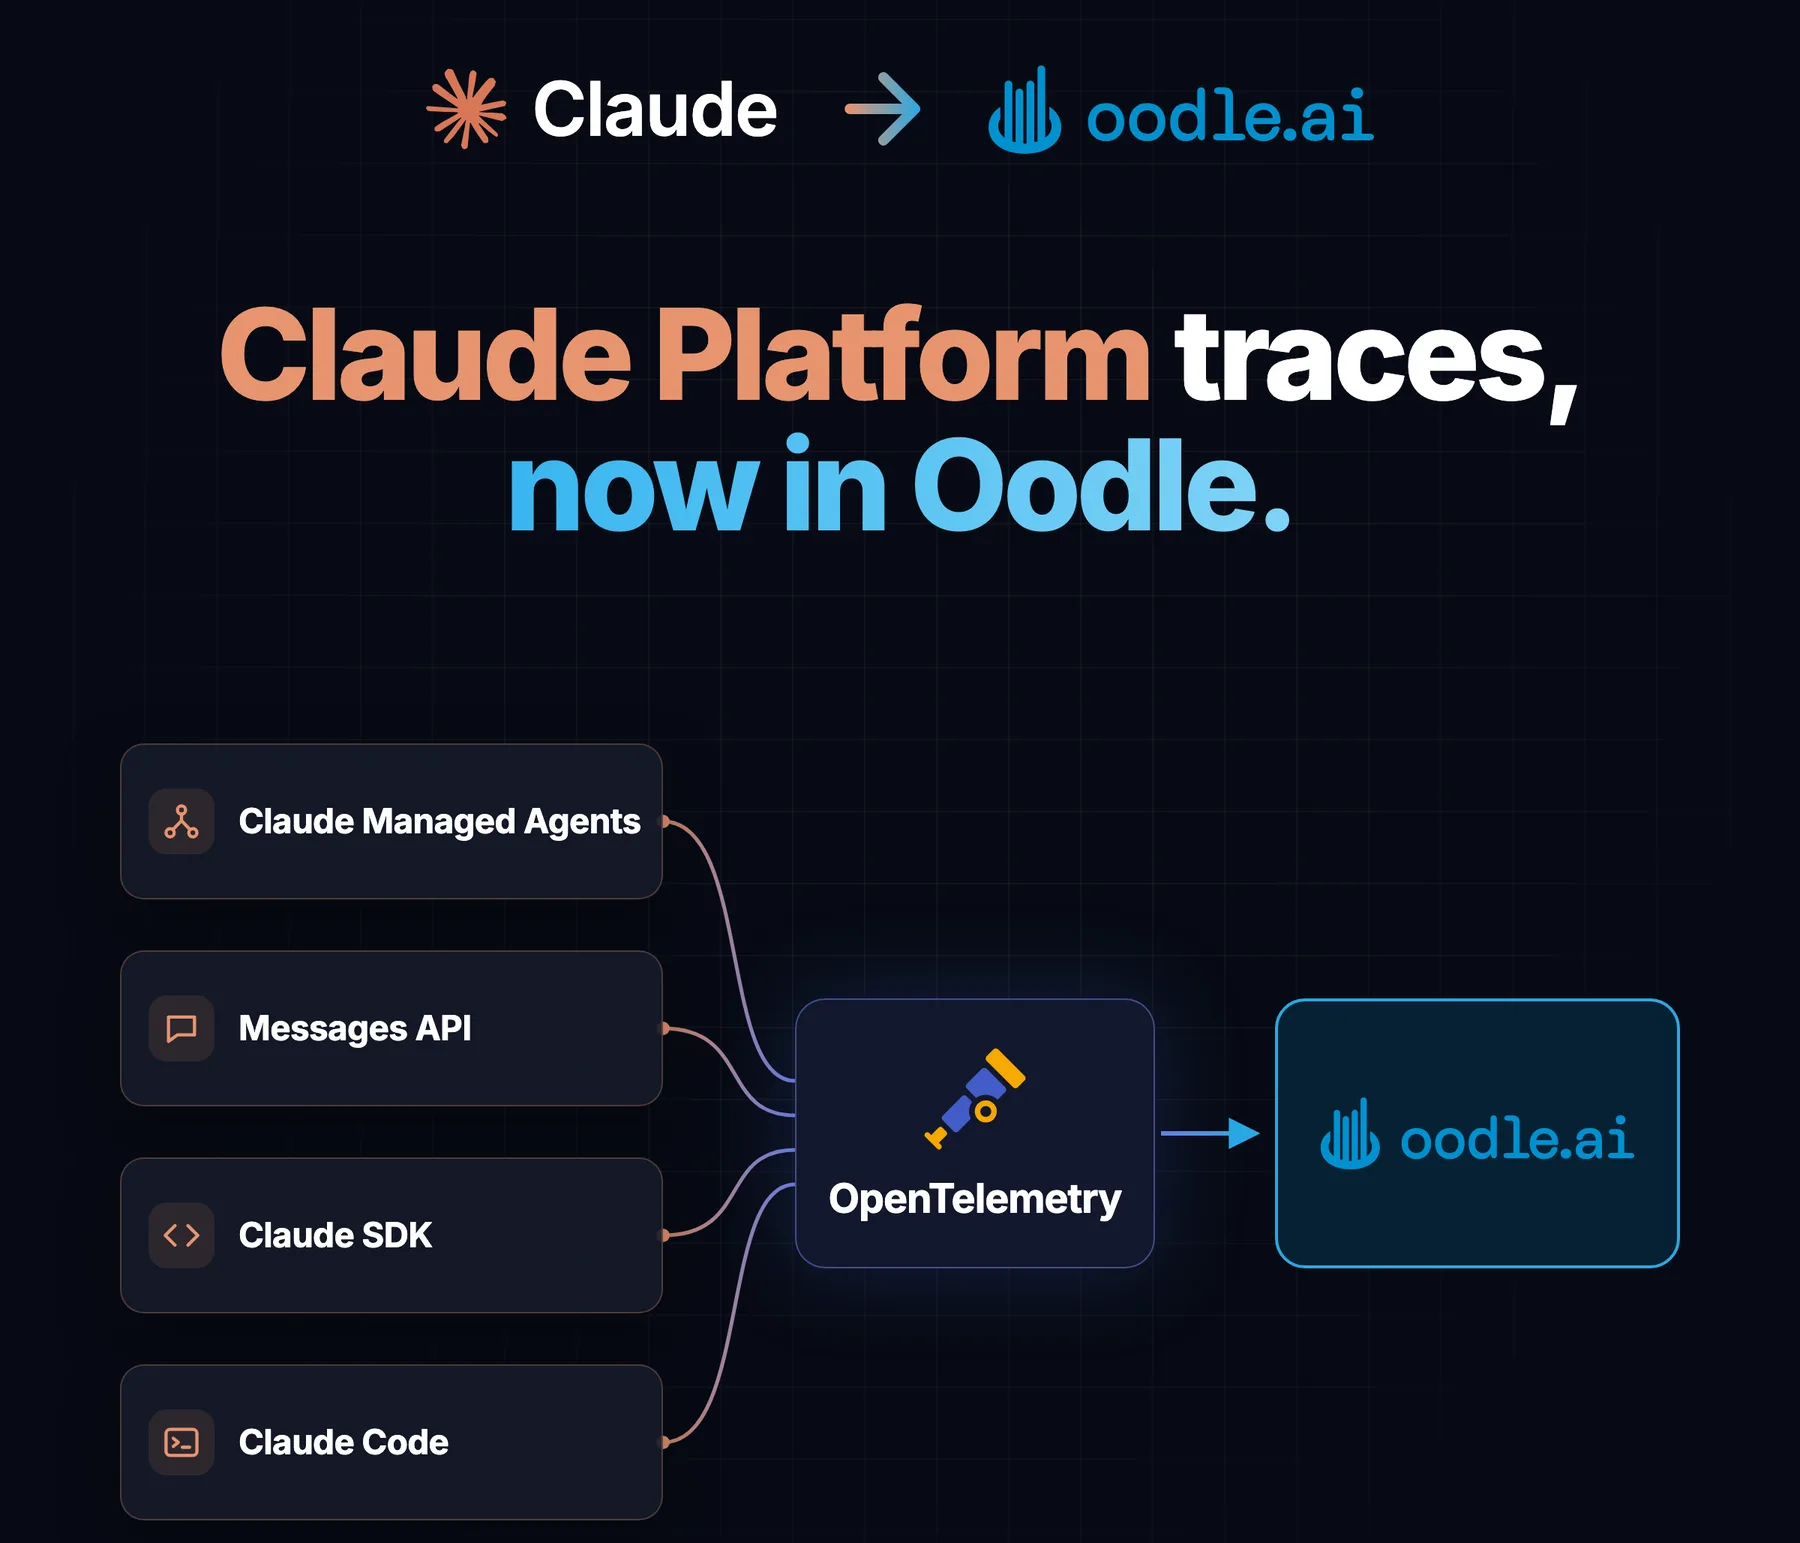
On October 14, 2026, Anthropic announced OpenTelemetry tracing for the Claude Platform, and we at Oodle announced support for it. The first question I got: what does this actually mean?
In this post I'll break it down: what Anthropic shipped, why it matters for your AI agent stack, and how to see it working in a few minutes.
What is Claude Platform
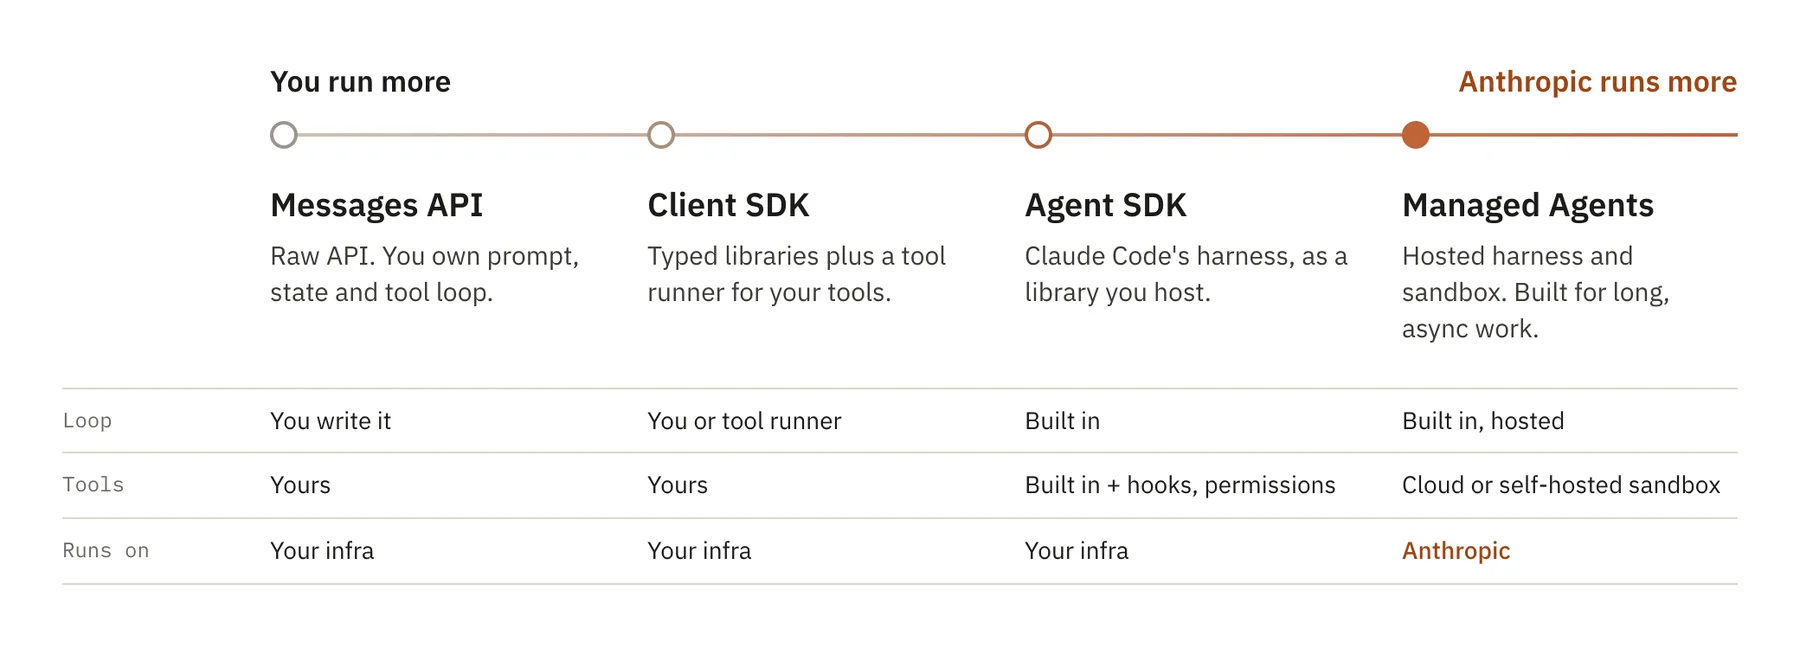
Most people know Claude Code and Claude.ai. Only a few know about the Claude Platform: Anthropic's developer platform, managed in the Claude Console. It gives you four ways to build an agent:
- Claude Managed Agents. A ready-made agent harness that runs on Anthropic's infrastructure, with a sandbox for code and tools. It suits long-running and asynchronous tasks.
- Messages API. The raw API. You build the prompt, keep the conversation state and run the tool loop yourself.
- Claude Client SDK. Client libraries for Python, TypeScript and other languages, including a tool runner that calls your own tools.
- Claude Agent SDK. The harness behind Claude Code, as a Python and TypeScript library you run on your own infrastructure.
What Anthropic shipped
Until now, the only way to figure out what your Claude Managed Agent did was to crawl through sessions on Claude Console. A Managed Agents session runs on Anthropic's servers, so its turns and sandbox tool calls were a black box. With the Messages API you saw your request and the response, but not the model calls and server tools in between.
Now Claude emits OpenTelemetry traces from two places:
- API tracing. An org admin adds an OTLP destination in the Claude Console once. From then on, Anthropic sends a span for every agent turn, model call and tool use, from its side, with latency, token counts and IDs. This covers the Messages API and Managed Agents, whatever client made the request.
- SDK tracing. The Claude SDKs emit spans from your own process: each request, the tool runner and your custom tools.
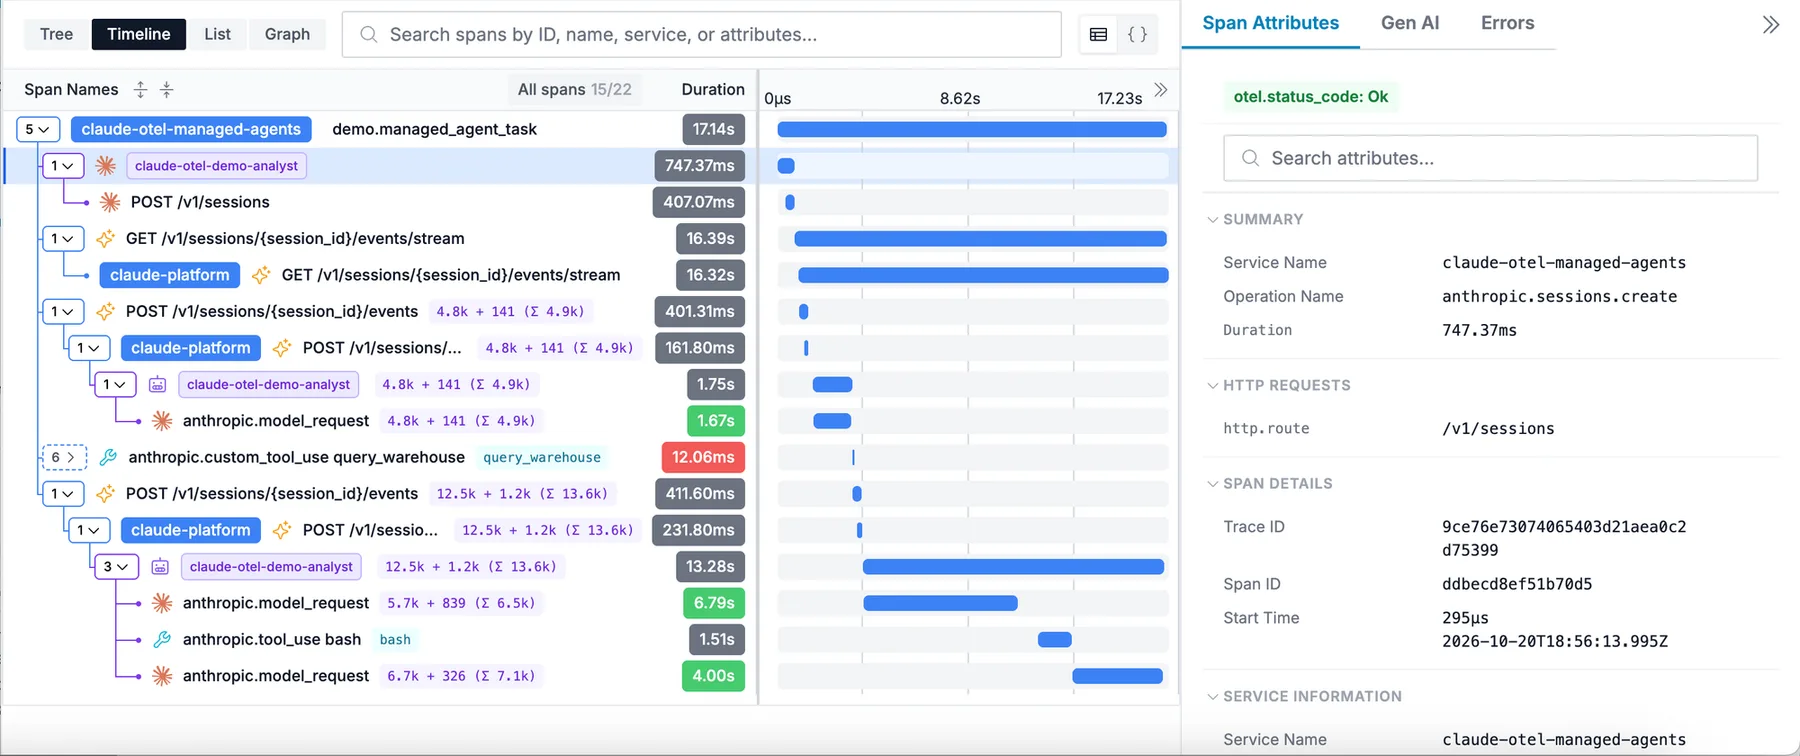
The two join up through the standard traceparent header, so you get one trace from your code, through Claude's model turns and tools, and back. Here is a single tool-runner call. The claude-platform spans come from Anthropic, the rest from the app:
Claude Code already had support to export traces from sessions via OpenTelemetry - this announcement didn't change that fact.
Why it matters
When an agent gives a wrong answer, the cause is usually somewhere in the middle: a tool call that failed, an MCP server that timed out, a turn that went in circles and burned tokens. With one trace per session, you look at that step instead of guessing.
Once those traces are in a reliable telemetry provider, you can:
- Quickly find the sessions that failed. Filter for sessions where a tool call or MCP call returned an error, and open the turn where it went wrong.
- Combine with APM traces to find and fix issues. Pinpoint slow requests, timeouts, and backend errors, identify root causes, and fix issues faster.
- Replay against real session data. Add those sessions to a dataset and run your agent against it, so you test with what users actually asked, not made-up examples.
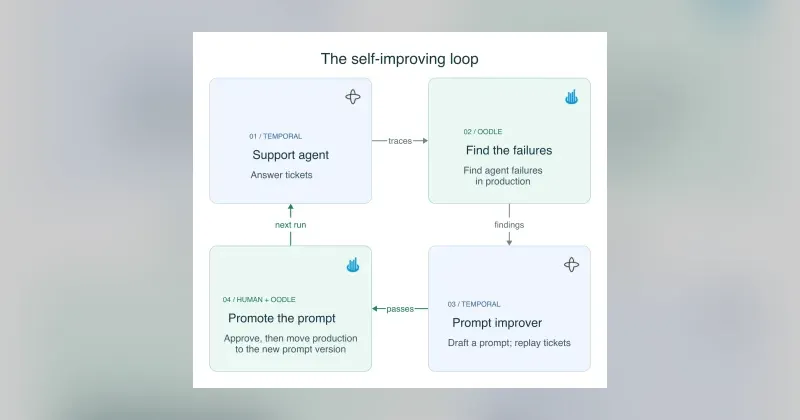
- Close the loop. Change a prompt or a tool, run the experiment again, and check the failures are fixed before you ship. That is the start of an agent that improves from its own production data.
Try it yourself
I've setup a demo project that sets up a simple Sales Analyst agent and runs all this end to end. You need Docker, an Oodle account and an Anthropic API key.